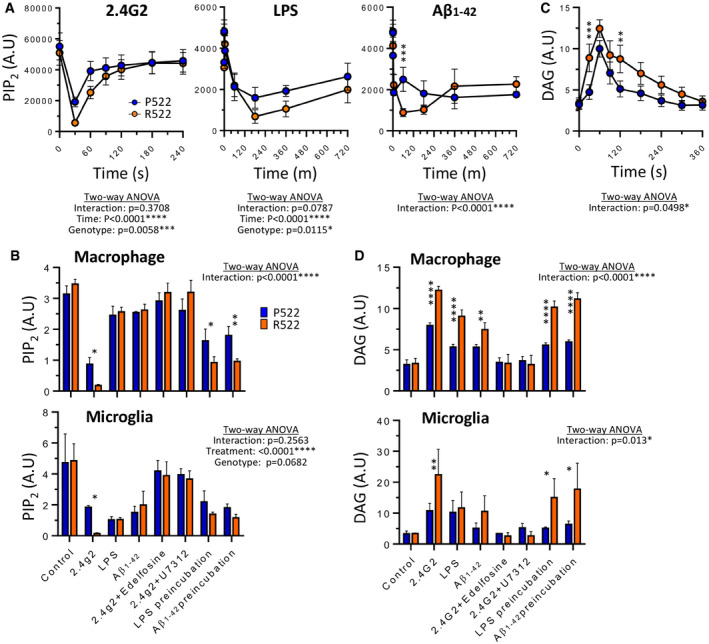
The level of PIP
2 in M‐MOPS was examined by measuring immunofluorescence from images at set time points after exposure to 5 µg/ml anti‐FcγRII/III (2.4G2), 50 ng/ml LPS or oligomers of 40 µM Aβ1–42 (A). The levels of PIP
2 were also measured using a plate reader after exposure to physiologically relevant stimuli in M‐MOPS and primary mouse microglia (B). DAG level was measured using a live‐cell assay in M‐MOPS (and primary mouse microglia as a time course from immunofluorescence (C) and plate reader after exposure to physiologically relevant stimuli (D). Data show the mean ± SD of three independent experiments and were analysed by two‐way ANOVA with Sidak’s multiple comparison. *
P < 0.05, **
P < 0.01, ***
P < 0.001 and ****
P < 0.0001 (blue: P522 and red: R522). See also Appendix Fig
S2.