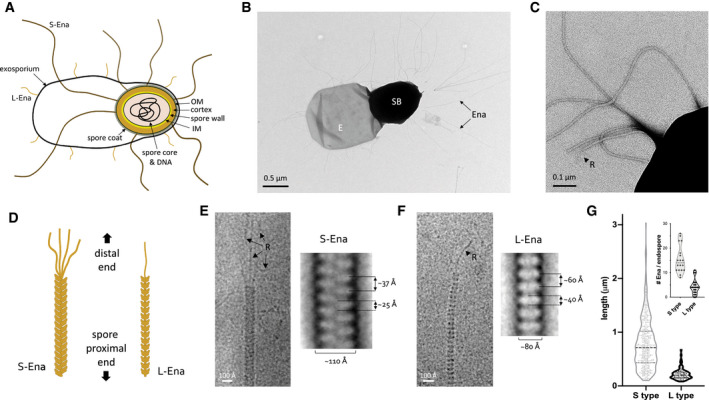
Figure 1. Bacillus cereus endospores carry S‐ and L‐Enas.

-
ASchematic representation of the B. cereus endospore. IM: inner membrane, OM: outer membrane. Together, spore core, IM, spore wall, cortex, OM, and spore coat make the spore body, surrounded by the exosporium. S‐ and L‐Ena represent staggered and ladder type endospore appendages – see this study.
-
B, CNegative stain TEM image of B. cereus NVH 0075‐95 endospore, showing spore body (SB), exosporium (E), and endospore appendages (Ena), which emerge from the endospore individually or as fiber bundles. At the distal end, Enas terminate in a single or multiple thin ruffles (R).
-
DSchematic drawing of S‐ and L‐Ena appearance and their orientation relative to the spore.
-
E, FcryoEM images (left) and negative stain 2D class averages of single S‐Ena (E) and L‐Ena (F) fibers. S‐Ena shows ˜100 Å diameter and a helical or staggered appearance with a ˜37 Å rise, whereas L‐Ena has a ˜80 Å diameter and appear as stacked disks of ˜40 Å height and ˜60 Å translation along the fiber. L‐ and S‐Ena show, respectively, a single or multiple ruffle(s) (black arrow, labeled “R”) at the distal end of fiber.
-
GLength distribution of S‐ and L‐Enas and number of Enas per endospore (inset), (n = 1,023 individual Enas, from 150 endospores, from 5 batches). Dashed and dotted lines show median and first (lower) and third (upper) quartile, resp. See also Fig EV1.
