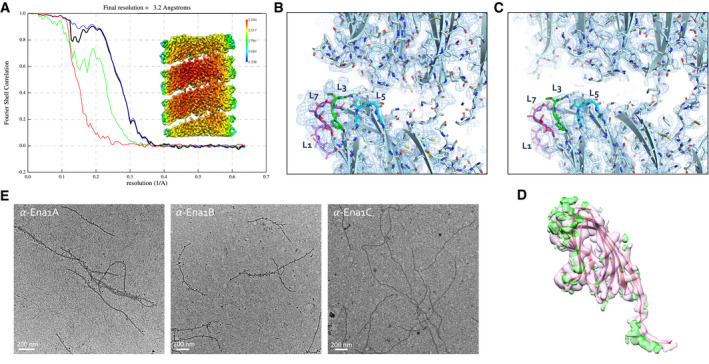
Figure EV2. S‐Ena is composed of both Ena1A and Ena1B subunits.

-
AFSC curve and local resolution heatmap (inset) of the recEna1B helical reconstruction, indicating a final resolution of 3.2 Å at a cutoff of 0.143. FSC curve and local resolution were calculated by postprocessing in RELION3.0 using a solvent mask consisting of 3 helical turns.
-
B, CSide‐by‐side comparison of cryoEM maps calculated from ex vivo (B) and recEna1B filaments (C), with the refined Ena1B model docked into the maps. The ex vivo Ena map shows features unaccounted for by the Ena1B model near loops 3 (L3) and 7 (L7), corresponding to regions of amino acid insertions in the Ena1A sequence (Fig EV2B).
- D
-
EImmunogold TEM of ex vivo S‐Enas, stained with, from left to right, anti‐Ena1A, anti‐Ena1B, and anti‐Ena1C sera, each with gold‐labeled (10 nm colloidal gold) anti‐rabbit IgG as secondary antibody. Specific staining with Ena1A and Ena1B sera confirms the presence of both subunits in native Enas. No staining was seen with Ena1C serum.
