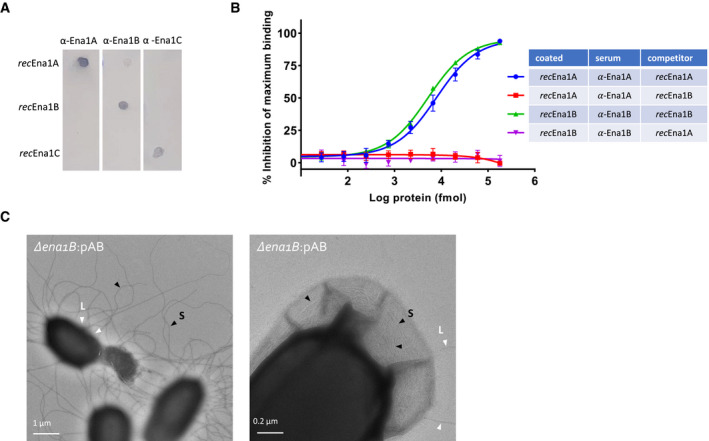
Figure EV3. Ena1 sera and Ena1A–Ena1B overexpression.

-
AEvaluation of residual cross‐reactivity in anti‐Ena1A, anti‐Ena1B, and anti‐Ena1C sera by dot blot. 100 ng of purified recEna1A, recEna1B, or recEna1C was coated on PVDF membrane, blocked, washed, and probed with the three different anti‐sera at 1:1,000 in TBST. Dot blot shows robust cognate binding with good selectivity against other Ena1 subunits.
-
BEvaluation of residual cross‐reactivity of anti‐Ena1A and anti‐Ena1B sera with recEnaB and recEnaA proteins, respectively, assayed using competitive ELISAs. The percentage inhibition of maximum binding was calculated using the formula (1‐(S‐B))/ (MA‐B) × 100, where S, B, and MA are the average absorbance of the sample (sera + recEna competitor added to the recEna‐coated wells), blank (only PBST added to the recEna‐coated wells), and maximum activity (only sera added to the recEna‐coated wells), respectively. The values presented are the averages of three independent experiments, and error bars depict ±SD of the averages. The lines are regression curves from three‐parameter logistic regression analyses (GraphPad prism version 9).
-
CNegative stain TEM images of endospores of NVH 0075‐95 mutant Δena1B complemented with pena1AB. Complementation with pena1AB results in aberrantly long and numerous S‐Ena (Fig 6). This overexpression of S‐Ena results in the frequent rupture of the exosporium (left panel), or the encapsulated of the S‐Ena into the exosporium (right panel). Selected S‐Ena and L‐Ena are labeled with black and with arrows, and labeled S and L, respectively.
