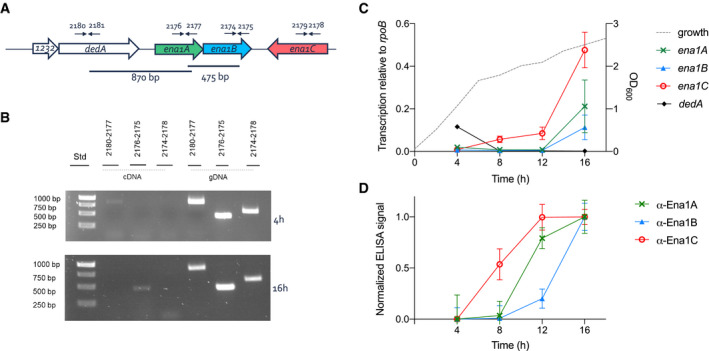
Figure 5. ena is bicistronic and expressed during sporulation.

-
AChromosomal organization of the ena genes and primers used for transcript analysis (arrows).
-
BAgarose gel electrophoresis (1%) analysis of RT–PCR products using indicated primer pairs and cDNA made of mRNA isolated from NVH 0075‐95 after 4 and 16 h of growth in liquid cultures or genomic DNA as control.
-
CTranscription level of ena1A (x), ena1B (▲), ena1C (○), and dedA (♦) relative to rpoB determined by RT–qPCR during 16 h of growth of B. cereus strain NVH 0075‐95. The dotted line represents the bacterial growth measured by increase in OD600. Of note, the transcription of ena1C was surprisingly higher than ena1A and ena1B, the major components of the isolated S‐Ena (Fig EV2).
-
DExpression analysis of Ena1 subunits shown as normalized ELISA signal for α‐Ena1A, α‐Ena1B, or α‐Ena1C serum binding to 2,000 ng total protein of B. cereus strain NVH 0075‐95 cells lysed after 4, 8, 12, or 16 h of growth in sporulation medium.
Data information: Error bars represent standard deviation of three independent experiments, with two technical replicates each.
