-
A
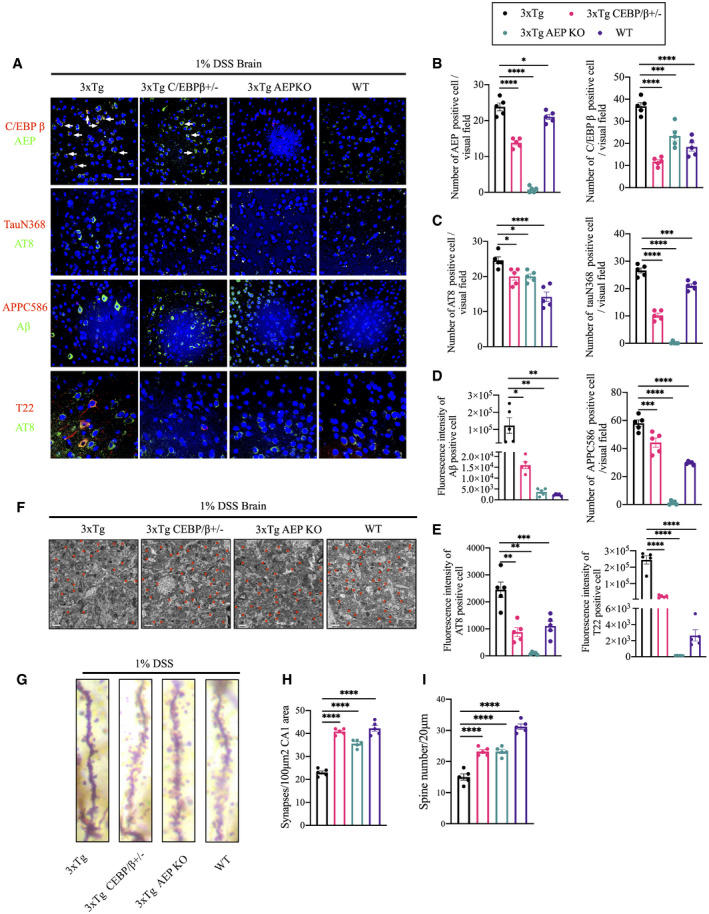
Immunofluorescent staining of C/EBPβ (red) and AEP (green), Iba‐1 (red) and AEP (green), cleaved Tau N368 (red) and AT8 (green), cleaved APP C856 (red) and Aβ (green), T22 (red) and AT8 (green) in cerebral cortex of brains from DSS‐treated mice. Scale bar: 20 μm. White arrows indicate that C/EBPβ and AEP were co‐localized in mouse brain.
-
B
Quantitative analysis of AEP‐positive cells and C/EBPβ‐positive cells, respectively. The density of both AEP‐positive cells and C/EBPβ‐positive cells was significantly decreased through knocking down C/EBPβ or knocking out AEP in mice. Representative data of five samples, data are shown as mean± SEM. *P = 0.0390, ***P = 0.0002, ****P < 0.0001, one‐way ANOVA.
-
C
Quantitative analysis of AT8‐positive cells (left) and TauN368‐positive cells (right), respectively. The density of both AT8‐positive cells and TauN368‐positive cells was significantly decreased through knocking down C/EBPβ or knocking out AEP in mice. n = 5 in each group, data are shown as mean± SEM. *P = 0.0194, ***P = 0.0001, ****P < 0.0001, one‐way ANOVA.
-
D
Quantitative analysis of Aβ‐positive cells (left) and APPC586‐positive cells (right), respectively. The fluorescence intensity of Aβ‐positive cells and the density APPC586‐positive cells were significantly decreased through knocking down C/EBPβ or knocking out AEP in mice. Representative data of five samples, data are shown as mean± SEM. *P = 0.0107, **P = 0.0048 (3xTg vs. 3xTg AEP KO), **P = 0.0044 (3xTg vs. WT), ***P = 0.0006, ****P < 0.0001, one‐way ANOVA.
-
E
Quantitative analysis of AT8‐positive cells (upper) and T22‐positive cells (lower), respectively. The fluorescence intensity of both AT8‐positive cells and T22‐positive cells was significantly decreased through knocking down C/EBPβ or knocking out AEP in mice. Representative data of five samples, data are shown as mean± SEM. **P = 0.0014 (3xTg vs. 3xTg C/EBPβ+/−), **P = 0.0030 (3xTg vs. 3xTg AEP KO), ***P = 0.001, ****P < 0.0001, one‐way ANOVA.
-
F
Representative electron microscopy of the synaptic structures in hippocampus of brains from DSS‐treated mice. Red stars indicate the synapses (scale bar: 1 μm).
-
G
The dendritic spines from the apical dendritic layer of the cerebral cortex region were analyzed by Golgi staining (scale bar: 5 μm).
-
H
Quantitative analysis of the synaptic densities in DSS‐treated mice. Representative data of five samples, data are shown as mean ± SEM. ****P < 0.0001, one‐way ANOVA.
-
I
Quantitative analysis of the spine density. Representative data of five samples, data are shown as mean ± SEM. ****P < 0.0001, one‐way ANOVA.

