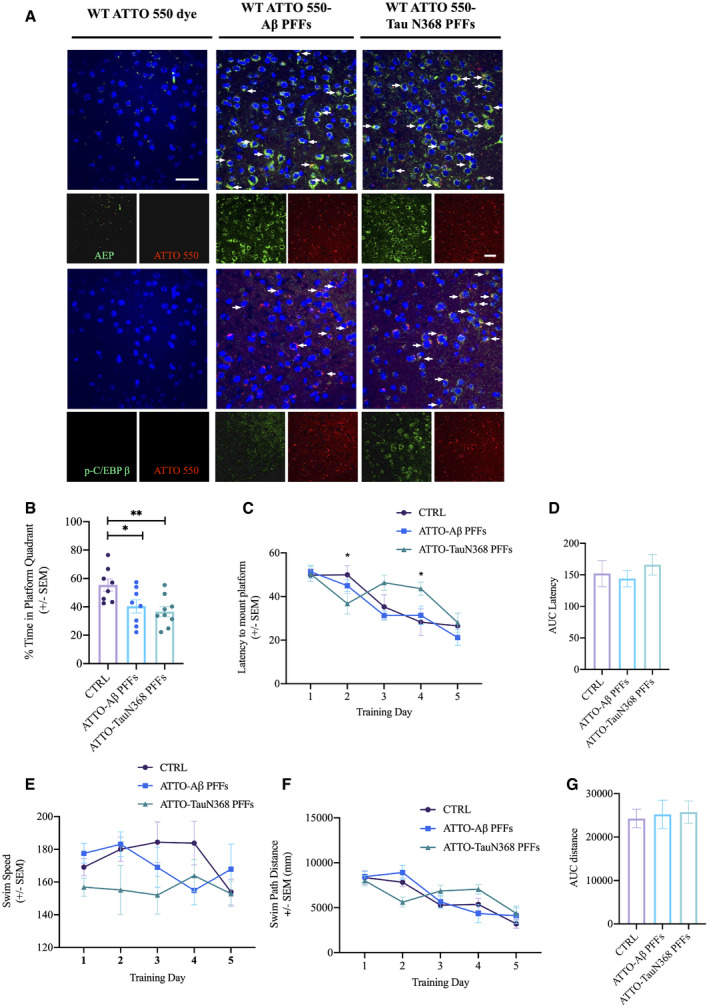
Figure 7. Colonic inoculation of recombinant Aβ PFFs or Tau N368 PFFs activates C/EBPβ/δ‐secretase pathway in WT mice brain.

-
AImmunofluorescent staining of AEP and p‐C/EBPβ in cerebral cortex of brains of WT mice 6 months after colonic inoculation with either Aβ PFFs or Tau N368 PFFs. Scale bar: 20 μm. White arrows indicate that AEP and p‐C/EBPβ signals (green) were co‐localized with ATTO 550 signals (red), respectively.
-
B–GMorris water maze test. Data represent the mean ± SEM. Colonic‐injected mice (n = 7 per group) were trained in the water maze over five days. Shown are the percentage of time spent in the target quadrant in the probe trail, *P = 0.0362, **P = 0.0072, unpaired t‐tests (B), Latency to platform, *P = 0.0434, *P = 0.0166, two‐way ANOVA (C), the area under curve of Latency (AUC Latency) (D), Swim Speed (E), Swim Path Distance (F), the area under curve of Swim Path Distance (AUC distance) (G).
Source data are available online for this figure.
