
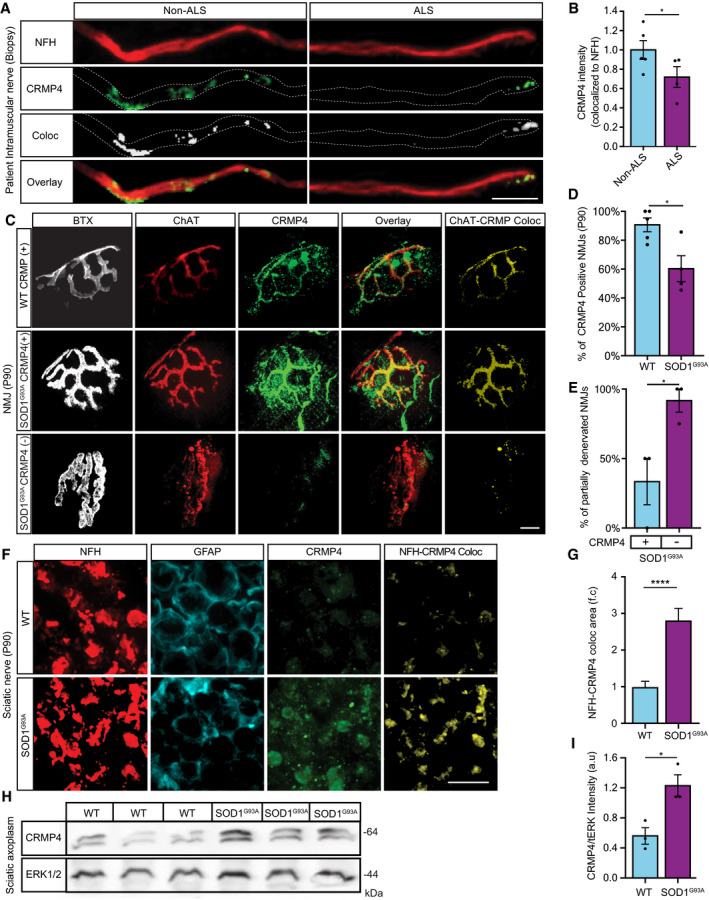
Figure 2. CRMP4 is mislocalized in ALS motor units.
-
ARepresentative images of ALS patient or non‐ALS human control intra‐muscular nerves. Red: denotes NFH, Green: denotes CRMP4, White: denotes co‐localization area using Imaris software. Scale bar: 20 μm.
-
BQuantification of CRMP4 intensity levels in NFH‐positive intra‐muscular distal nerves from 5 non‐ALS controls and 4 sALS patients. We analyzed 40 terminal axons from the healthy samples (~ 8 axons per sample) and 36 terminal axons from sALS samples (~ 8 axons per sample). Data presented as mean ± SE. Student's t‐test, *P = 0.0475.
-
CRepresentative images of SOD1G93A/ChAT::tdTomato or WTChAT::tdTomato neuromuscular junctions (NMJ's) at P90. White: denotes BTX, Red: denotes direct ChAT, Green: denotes CRMP4, Yellow: denotes Z projection of 3D Imaris co‐localization of CRMP4 and ChAT. Scale bar: 10 µm.
-
DQuantification of CRMP4‐positive NMJ's in gastrocnemius muscles from 3 WT or 3 SOD1G93A P90 mice. Total of 44 NMJ’s in WT condition and 60 NMJ’s in SOD1G93A condition. Student's t‐test, n = 3, data presented as mean ± SE, *P = 0.0157.
-
EQuantification of the percent of partially denervated NMJ’s in the presence or absence of CRMP4 immunostaining in 3 different SOD1G93A mice. We counted 24 NMJ’s in SOD1G93A CRMP4 negatives and 67 NMJ’s in SOD1G93A CRMP4 positives. Student's t‐test, n = 3, data presented as mean ± SE, *P = 0.0352.
-
FRepresentative images of P90 SOD1G93A and WT sciatic nerves. Red: denotes NFH, Cyan: denotes GFAP and green denotes CRMP4, Yellow: denotes the Z projection of 3D Imaris co‐localization of CRMP4 and NFH. Scale bar: 5 μm.
-
GQuantification of the co‐localization area of CRMP4 with NFH in the sciatic nerve in 3 SOD1G93A mice compared to 3 WT mice using Imaris analysis. 14 WT sciatic nerve sections and 11 SOD1G93A sections were monitored. Data presented as mean ± SE. Student's t‐test, n = 3, ****P < 0.0001.
-
H, IWestern blot analysis and quantification of 3 independent repeats of P90 SN tissues for CRMP4 expression levels (size of ~ 64 kDa) in SOD1G93A compared to WT. tERK was used as a loading control (size of ~ 44 kDa). Student's t‐test, n = 3, data presented as mean ± SE, *P = 0.0215.
Source data are available online for this figure.