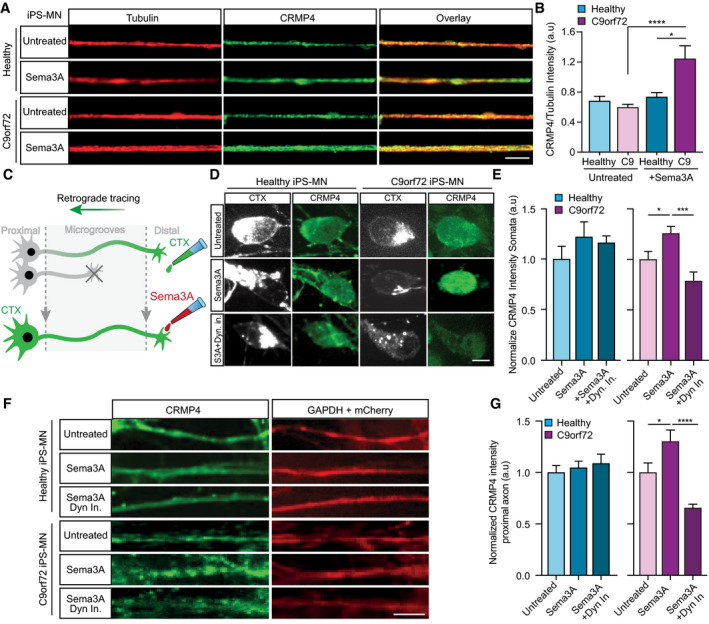
Representative images of healthy or C9orf72 iPSC‐derived MNs treated with Sema3A or untreated in the distal compartment, 8 h post‐treatment. Red: denotes Tubulin, Green: denotes CRMP4. Scale bar: 5 μm.
Quantification of CRMP4 intensity levels in healthy or C9orf72 iPSC‐derived MNs with Sema3A treatment or untreated. 14 untreated healthy axons, 12 healthy axons with Sema3A treatment, 49 untreated C9orf72 axons, and 31 C9orf72 axons with Sema3A treatment were monitored from 3 different chambers. One‐way ANOVA, Tukey's multiple comparisons test, n = 3, data presented as mean ± SE, *P = 0.0338; ****P < 0.0001.
Illustration of the experimental procedure for MNs in an MFC treated with the fluorescently tagged retrograde tracer CTX in the distal compartment. Neuronal cell bodies in the primary neuron whose axons have traversed into the distal compartment were also labeled by the retrograde tracer.
Representative images of healthy or C9orf72 human‐derived MN cell somata with Sema3A treatment, Sema3A + dynein inhibitor treatment, or untreated. Gray: denotes CTX, Green: denotes CRMP4. Scale bar: 5 μm.
Quantification of CRMP4 intensity (normalized to GAPDH + mCherry/area) levels at the somata of healthy or C9orf72 human‐derived MN after Sema3A treatment, Sema3A + dynein inhibitor treatment, or untreated. Analysis performed in 3 independent chambers per condition. 19 healthy untreated cell somata, 26 healthy cell somata with Sema3A treatment, 20 healthy cell somata with Sema3A + dynein inhibitor treatment and 14 C9orf72 cell somata from each condition were monitored. One‐way ANOVA, Newman–Keuls multiple comparisons test, n = 3, data presented as mean ± SE, *P = 0.0207; ***P = 0.0004.
Representative images of healthy or C9orf72 human‐derived MN proximal axons with Sema3A treatment, Sema3A + dynein inhibitor treatment, or untreated control. Green: denotes CRMP4, Red: denotes GAPDH. Scale bar: 5 μm.
Quantification of CRMP4 intensity levels (normalized to GAPDH + mCherry/area) at the proximal axons in healthy or C9orf72 human‐derived MN after Sema3A treatment, Sema3A + dynein inhibitor treatment, or untreated control. Analysis performed from 3 independent chambers in each condition. 21 healthy untreated proximal axons, 24 healthy proximal axons with Sema3A treatment, 16 healthy proximal axons with Sema3A + dynein inhibitor treatment, 12 C9orf72 untreated proximal axons, 8 C9orf72 proximal axons with Sema3A treatment and 13 C9orf72 proximal axons with Sema3A + dynein inhibitor treatment were monitored. One‐way ANOVA, Newman‐Keuls multiple comparisons test, n = 3, data presented as mean ± SE, *P = 0.0334, ****P < 0.0001.