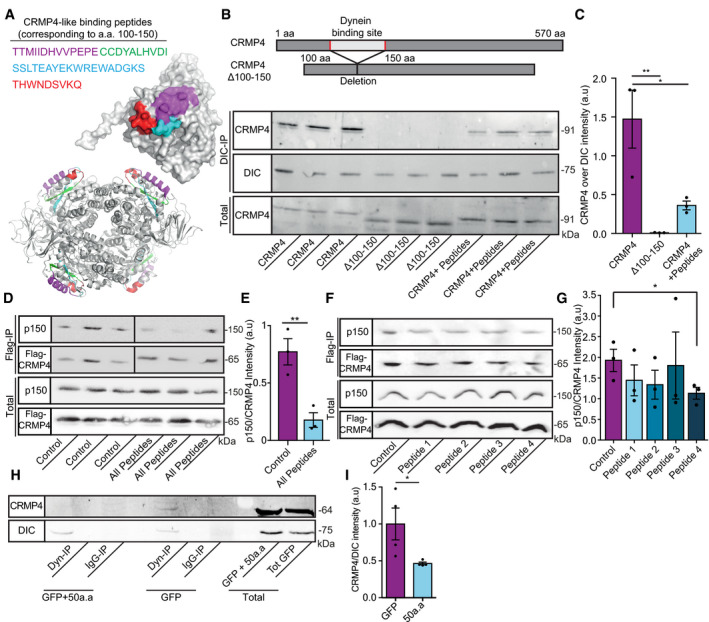
Figure 4. CRMP4 binds dynein via a specific 50 amino acid motif.

- Crystal structures (PDB code 4CNT) of a CRMP4 monomer (upper panel) and biological tetramer assembly (lower panel). The peptides that were selected to inhibit binding are highlighted and color coded as indicated.
- Upper panel represents the binding site domain of dynein in CRMP4 and its deletion. Middle panel—Immunoprecipitation of DIC followed by western blot analysis of CRMP4 in COS7 cells overexpressing either GFP‐CRMP4, or GFP‐CRMP4 with deletion of amino acid 100–150, or GFP‐CRMP4 overexpressing cells that were pre‐incubated with a 10 µm mixture of peptides 1–4 (size of ~ 91 kDa). Lower panel ‐ Western blot analysis of total protein levels before the pull‐down assay (DIC size: ~ 75 kDa).
- Quantification of the Western blot in B from 3 independent repeats. One‐way ANOVA, Tukey's multiple comparisons test, n = 3, data presented as mean ± SE, **P = 0.007, *P = 0.0261.
- Upper panel ‐ immunoprecipitation assay with anti‐Flag antibody followed by Western blot analysis of dynactin (p150) (size of ~ 150 kDa) in COS7 cells overexpressing Flag‐CRMP4 (size of ~ 65 kDa). Lower panel ‐ total protein input.
- Quantification of the blot in D from 3 independent repeats. The dynactin intensity band was normalized to the Flag‐CRMP4 intensity band in each repeat. Student’s t‐test, n = 3, data presented as mean ± SE, **P = 0.01.
- Upper panel ‐ Immunoprecipitation assay with anti‐Flag antibody followed by Western blot analysis of dynactin (p150) (size of ~ 150 kDa) in COS7 cells overexpressing Flag‐CRMP4 (size of ~ 65 kDa). Lower panel ‐ Total input.
- Quantification of the blot in F. The dynactin intensity band was normalized to the Flag‐CRMP4 intensity band in each repeat. Student’s t‐test, n = 3, data presented as mean ± SE, *P = 0.0299.
- Immunoprecipitation of DIC (size of ~ 75 kDa) followed by Western blot analysis of CRMP4 (size of ~ 64 kDa) in COS7 cells that were transfected with CRMP4 and AAV9‐50aa or its control. IgG antibody was used as a control.
- Quantification of the blot in H from 3 independent repeats. The CRMP4 intensity band was normalized to the DIC intensity band in each repeat. Student’s t‐test, n = 3, data presented as mean ± SE, *P = 0.0479.
Source data are available online for this figure.
