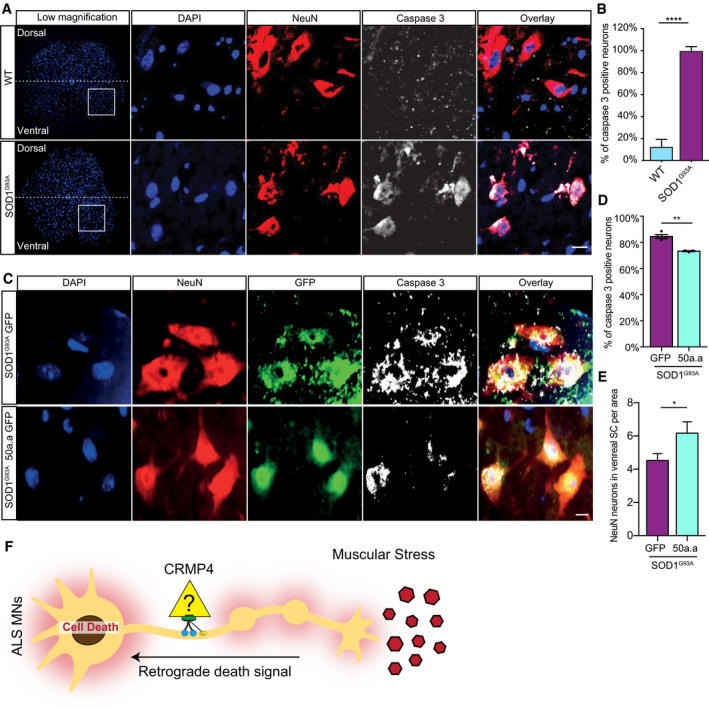
Representative images and insets of WT and SOD1G93A SC cross sections at P90. Blue: denotes DAPI, Red: denoted NeuN, and White: denotes activated caspase 3. Scale bar: 20 µm.
Quantification of active caspase 3‐positive cells in P90 WT and SOD1G93A SC. 3 different mice in each condition analyzed. We monitored active caspase 3 expression in total of 108 cells in WT SC and 123 cells in SOD1G93A. Student’s t‐test, n = 3, data presented as mean ± SE, ****P < 0.0001.
Representative images of P90 SOD1G93A mice SC cross sections that were injected with AAV9‐GFP/AAV9‐50aa‐GFP. Blue: denotes DAPI, Red: denoted NeuN, and White: denotes activated caspase 3. Scale bar: 10 µm.
Quantification of caspase 3‐positive cells in P90 SOD1G93A mice SC cross sections that were injected with either AAV9‐GFP or AAV9‐50aa‐GFP. Data collected from 3 different mice in each condition. We monitored active caspase 3 expression in total of 228 cells in P90 SOD1G93A mice SC cross sections that were injected with AAV9‐GFP and 179 cells P90 SOD1G93A mice SC cross sections that were injected with AAV9‐50aa‐GFP. Student’s t‐test, n = 3, data presented as mean ± SE, **P = 0.0019.
Quantification of the number of NeuN‐positive cells in P90 SOD1G93A mice SC cross sections that were injected with either AAV9‐GFP or AAV9‐50aa‐GFP. Data collected from 3 different mice in each condition. We monitored the number of NeuN‐positive cells from total of 228 cells in P90 SOD1G93A mice SC cross sections that were injected with AAV9‐GFP and 179 cells P90 SOD1G93A mice SC cross sections that were injected with AAV9‐50aa‐GFP. Unpaired t‐test with Welch's correction, n = 3, data presented as mean ± SE, *P = 0.0484.
Working model—CRMP4‐dynein complex formation is enhanced in ALS disease and leads to subtype‐specific neuronal loss.

