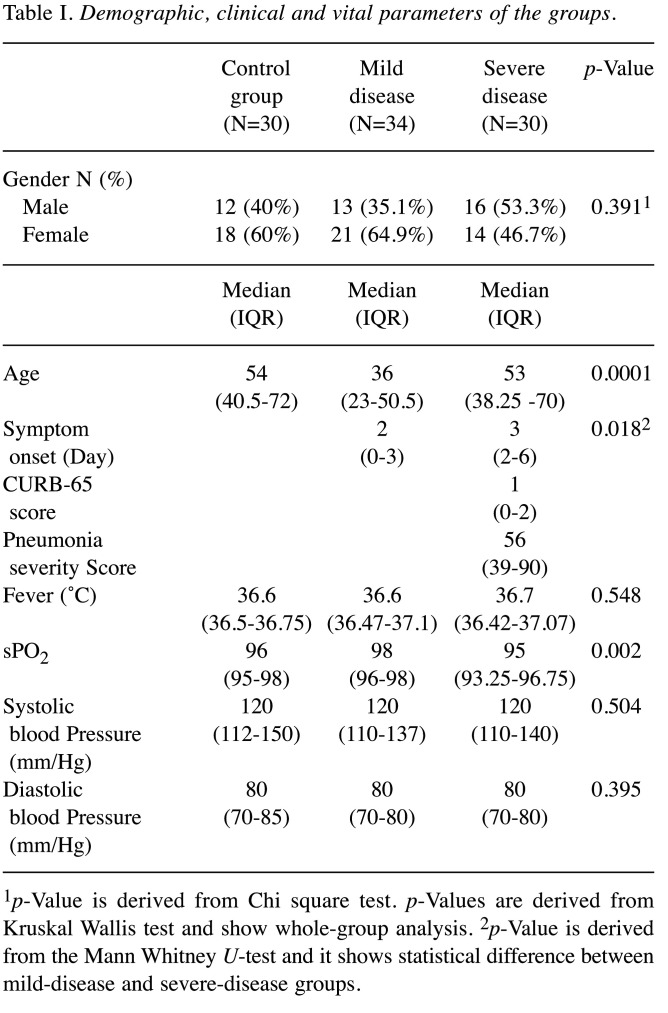
Table I. Demographic, clinical and vital parameters of the groups.
1p-Value is derived from Chi square test. p-Values are derived from Kruskal Wallis test and show whole-group analysis. 2p-Value is derived from the Mann Whitney U-test and it shows statistical difference between mild-disease and severe-disease groups.

