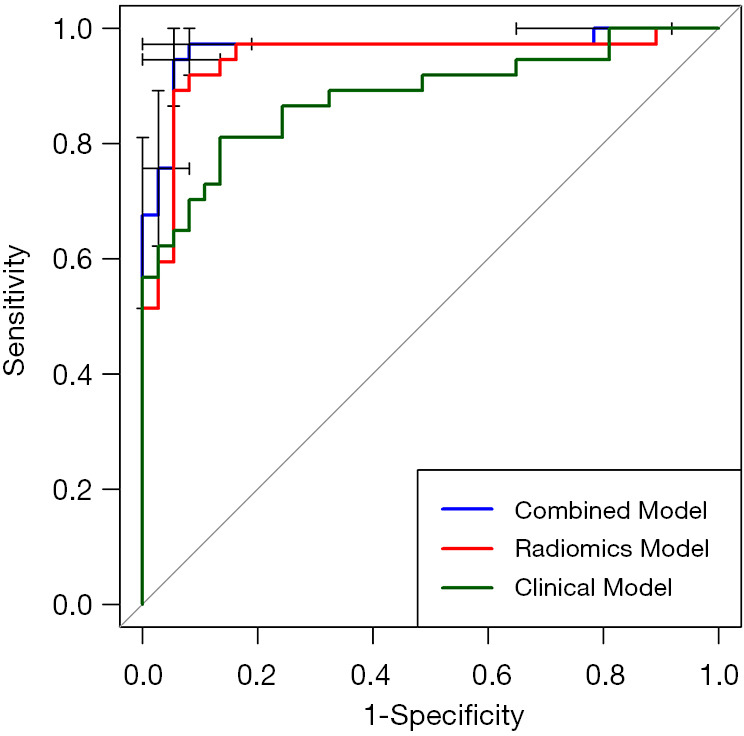
Figure 5.

Receiver operating characteristic (ROC) curves of the clinical, radiomics and combined models in the testing set. The error bars which represent 95% CI of combined model’s sensitivities and specificities were given in the figure. The combined model incorporating the clinical and radiomics features of contrast-enhanced mammography showed the highest area under the ROC curve (AUC) [0.964, 95% confidence interval (CI): 0.918–1.000]. The AUCs for the radiomics model and the clinical model were 0.947 (95% CI: 0.891–0.997) and 0.882 (95% CI: 0.803–0.962), respectively.
