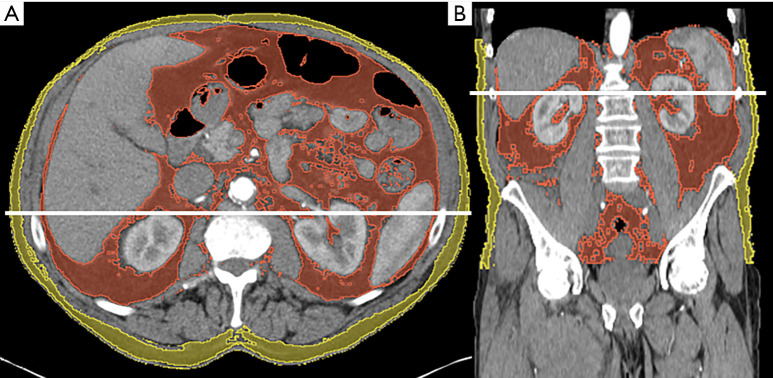
Figure 1.
Example of the semi-automatic segmentation of adipose tissue in an arterial scan. Single slice (2D) of the mid abdomen at L2/3 (A) and of the entire abdomen (3D) shown in coronal view (B). The solid line in each image represents the viewed plain of the other image. Thresholds for segmentation of adipose tissue were set between −190 and −30 HU. Visceral adipose tissue is marked in red. Subcutaneous adipose tissue is marked in yellow. Note the intramuscular hematoma in the medial compartment of the right thigh (B).

