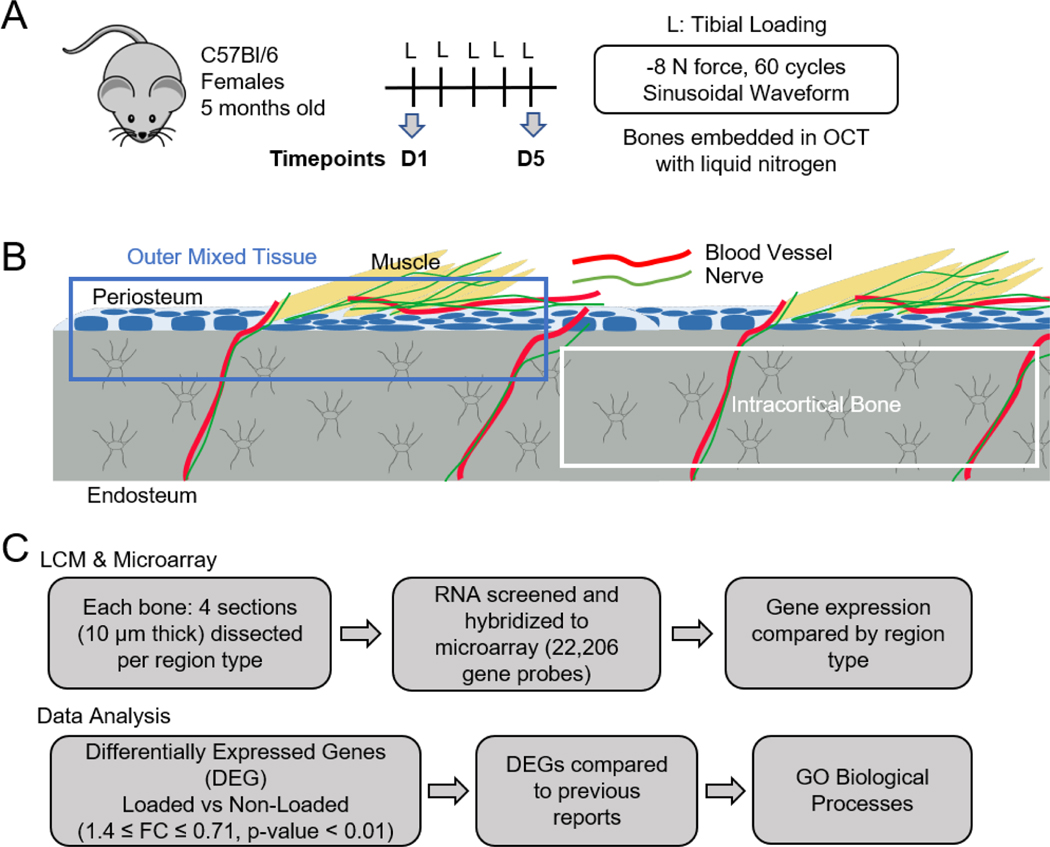
Figure 1.
Experimental design and workflow. (A) Flow chart showing experimental parameters for mechanical loading of mice; bones were harvested and embedded 4 h after last loading bout, on either day 1 or day 5. (B) Diagram illustrating Intra-CB (blue outline) and Mixed regions (blue outline) collected for RNA extraction. Yellow=Muscle, Blue=Osteoblasts and Progenitor Cells, Grey=Osteocytes. (C) Workflow from sample collection to microarray data processing and analysis.

