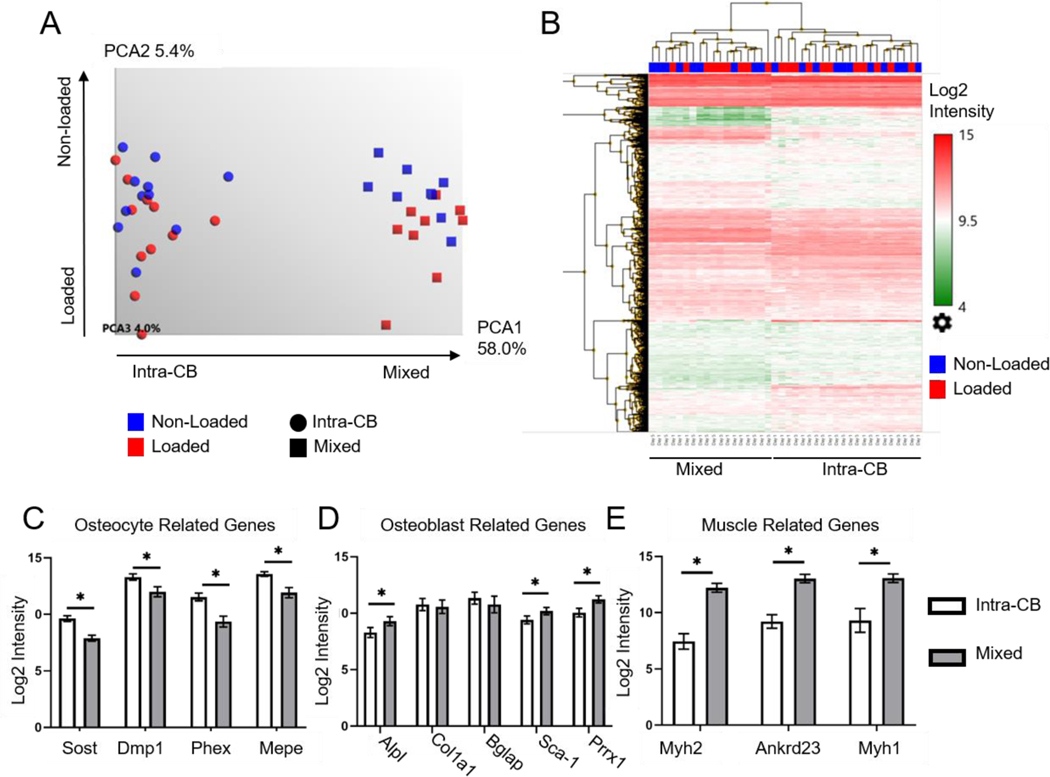
Figure 2.
LCM allowed dissection of distinct populations of cells from mouse tibias. (A) PCA of gene expression from regions of Intra-CB (n=22) and mixed tissue (n=18) showed separation of region-type along PC1. Loaded and non-loaded samples were not clearly separated. (B) Heat map of Log2 gene expression intensities of genes with average Intra-CB Log2 intensities greater than 9 (4,105 genes). This representation of highest expressing genes clustered primarily by region type. (C-E) Select genes demonstrated (C) higher expression of osteocyte-specific genes in Intra-CB, (D) higher expression of Alpl, Sca-1 and Prrx1 and (E) muscle related genes in mixed regions. *FDR p-value<0.05

