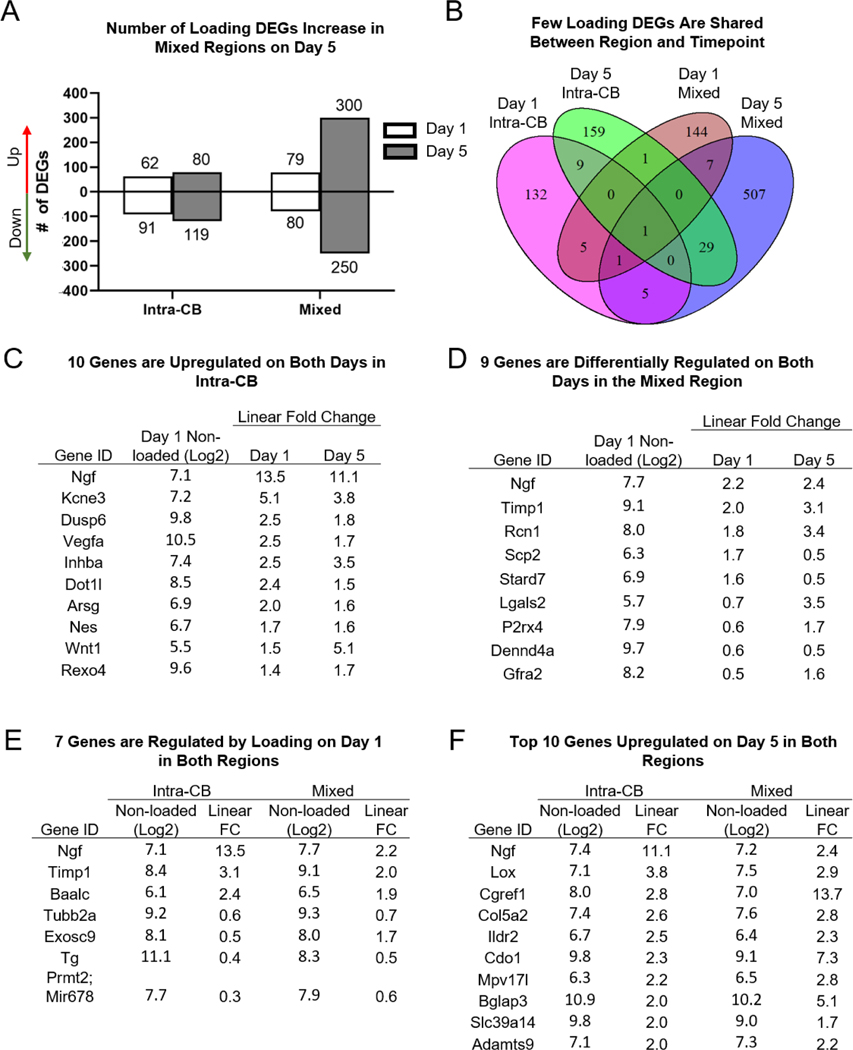
Figure 3.
More than 150 genes are differentially regulated by loading in Intra-CB on each day, with only 10 genes in common at both timepoints. (A) The number of DEGs is similar on both days in Intra-CB samples but an increase in number of DEGs occurs on day 5 in mixed regions. (B) Most genes are not shared between regions or timepoints. (C-D) Differentially regulated genes (C) in Intra-CB and (D) Mixed regions on both days (all 10, 9 shown) (E) in both regions on day1 (all 7 shown) and (F) in both regions on day 5 (top 10 shown). Values are basal gene intensity (Log2) and absolute fold change due to loading (loaded/non-loaded).

