Figure 4.
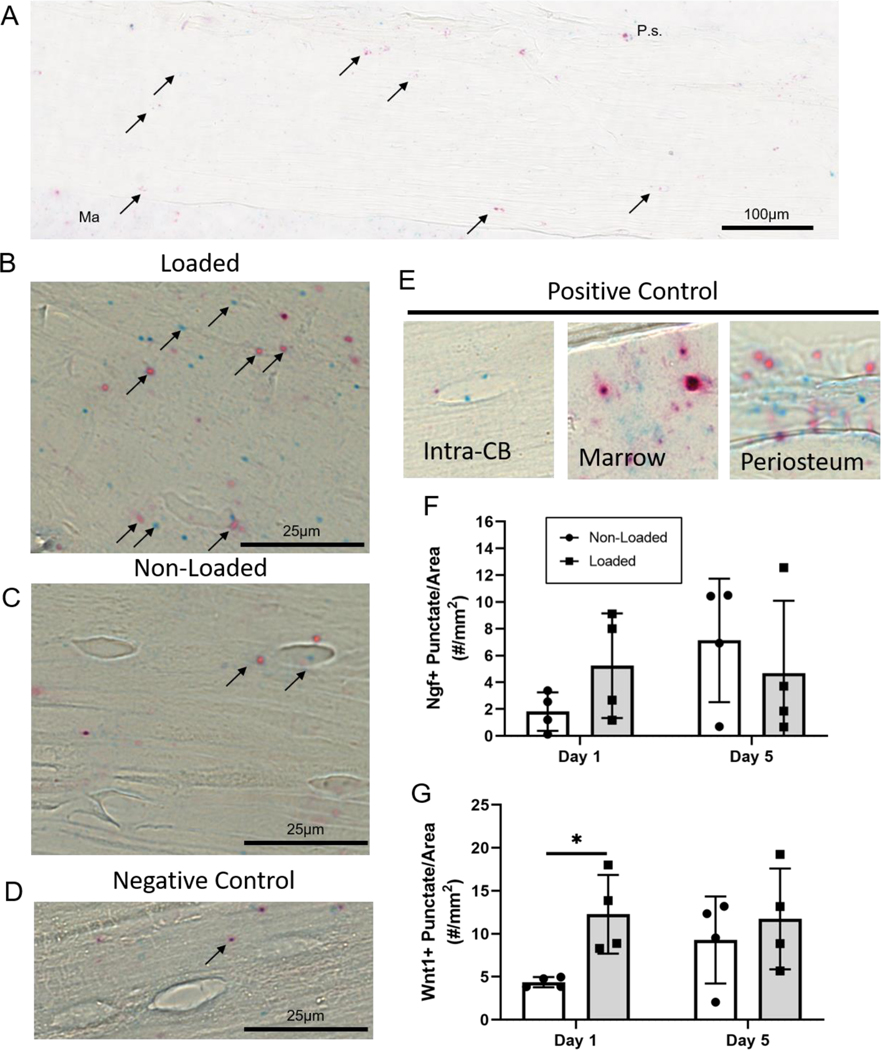
Loading increases Wnt1 expression in Intra-CB. (A) A region approximately 1-mm in length was analyzed for Wnt1 (red) or Ngf (blue) punctate dots representing RNA transcripts targeted by their respective probes (arrows). Representative images show the (B) loaded tibia had more Ngf and Wnt1 expression (in this sample) compared to (C) non-loaded tibias and (D) negative control probes detected minimal RNA transcripts within Intra-CB. (E) Positive control probes show staining in Intra-CB, and more abundantly in marrow, and periosteum. Punctate dots were quantified, showing (F) no significant change in Ngf at either timepoint and (G) a substantial increase in Wnt1 expression on day 1. Ma=Marrow, P.s.=Periosteal Surface.

