
Figure 2.
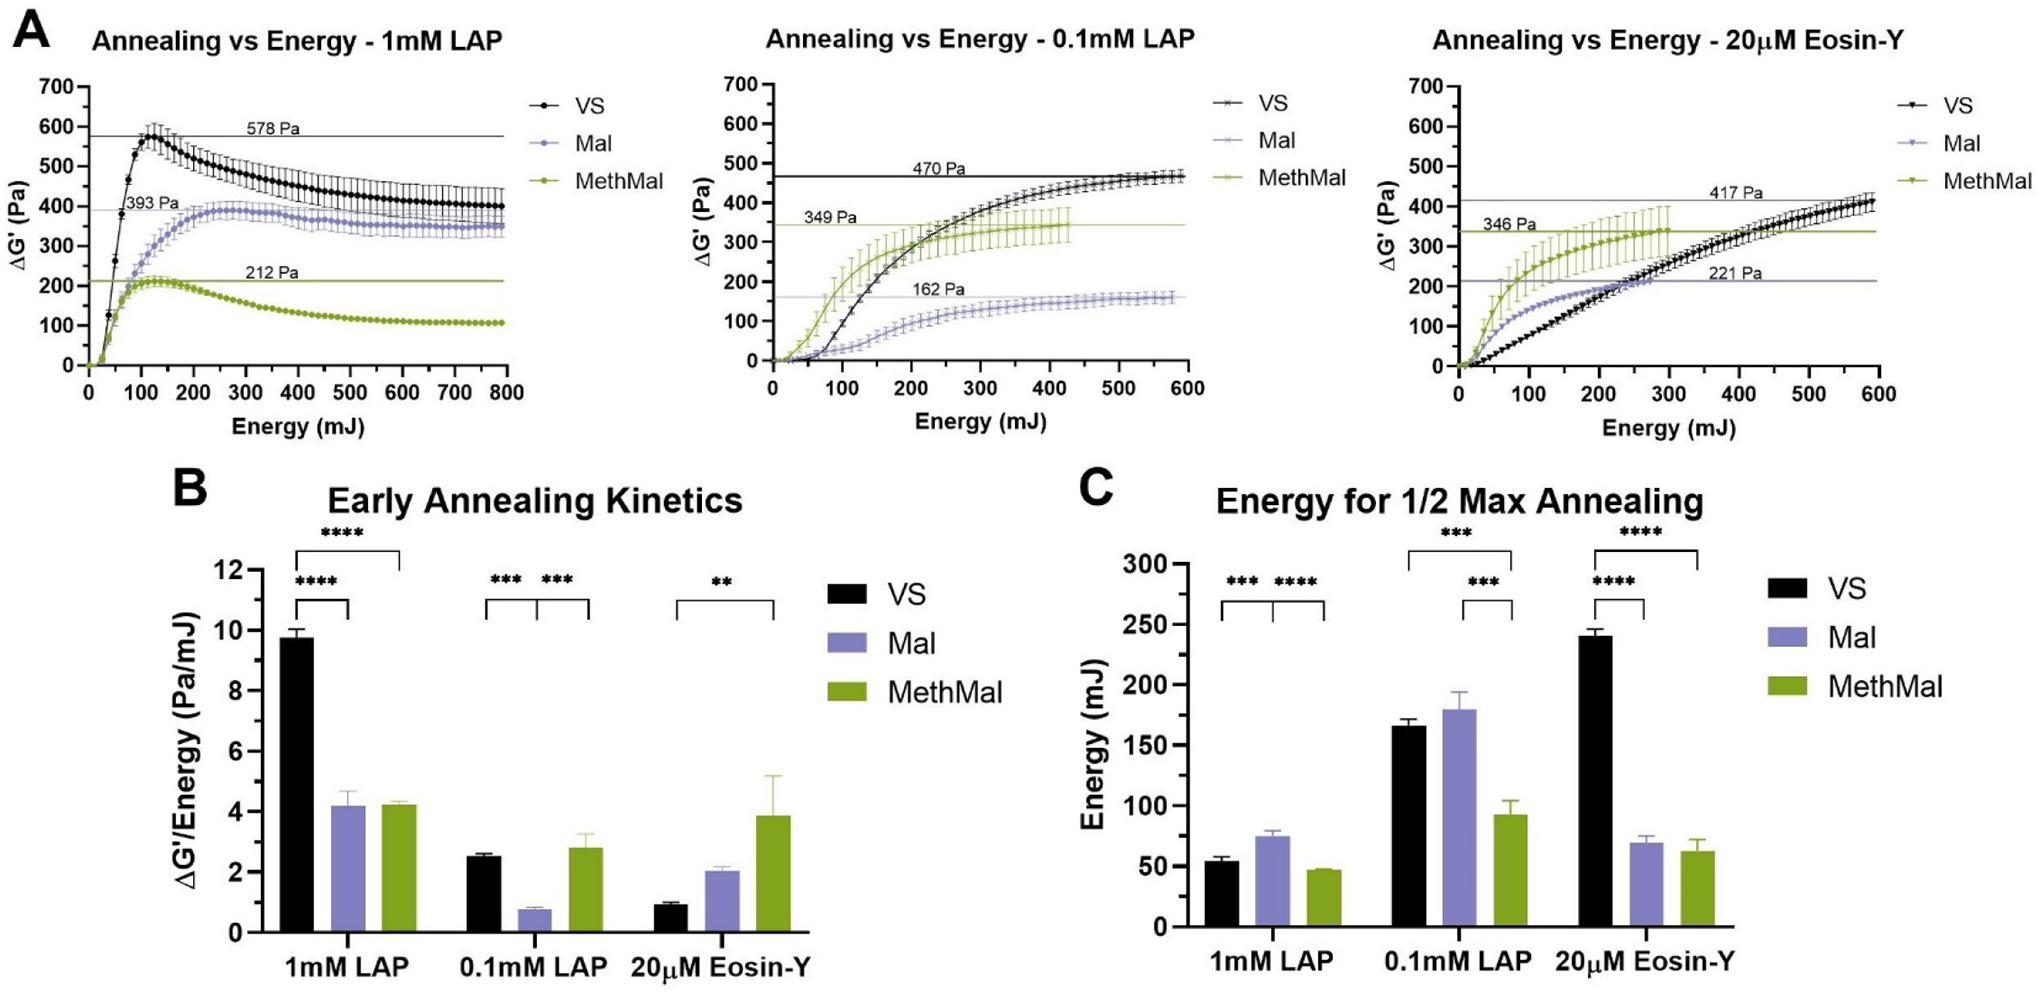
Quantification of annealing across photoinitiators via rheological analysis. A) Change in storage moduli compared to light energy introduced to the system. Horizontal lines indicate maximum ΔG’. B) Early annealing kinetics determined by maximum rates of change following toe regions of curve. C) Light energy required to reach one-half of the maximum increases in storage moduli. All graphs show mean +/− standard deviation. One-way ANOVAs followed by post-hoc multiple comparisons tests (Tukey HSD) were used to determine significance. **** p-value < 0.0001, *** p < 0.001, ** p < 0.01.