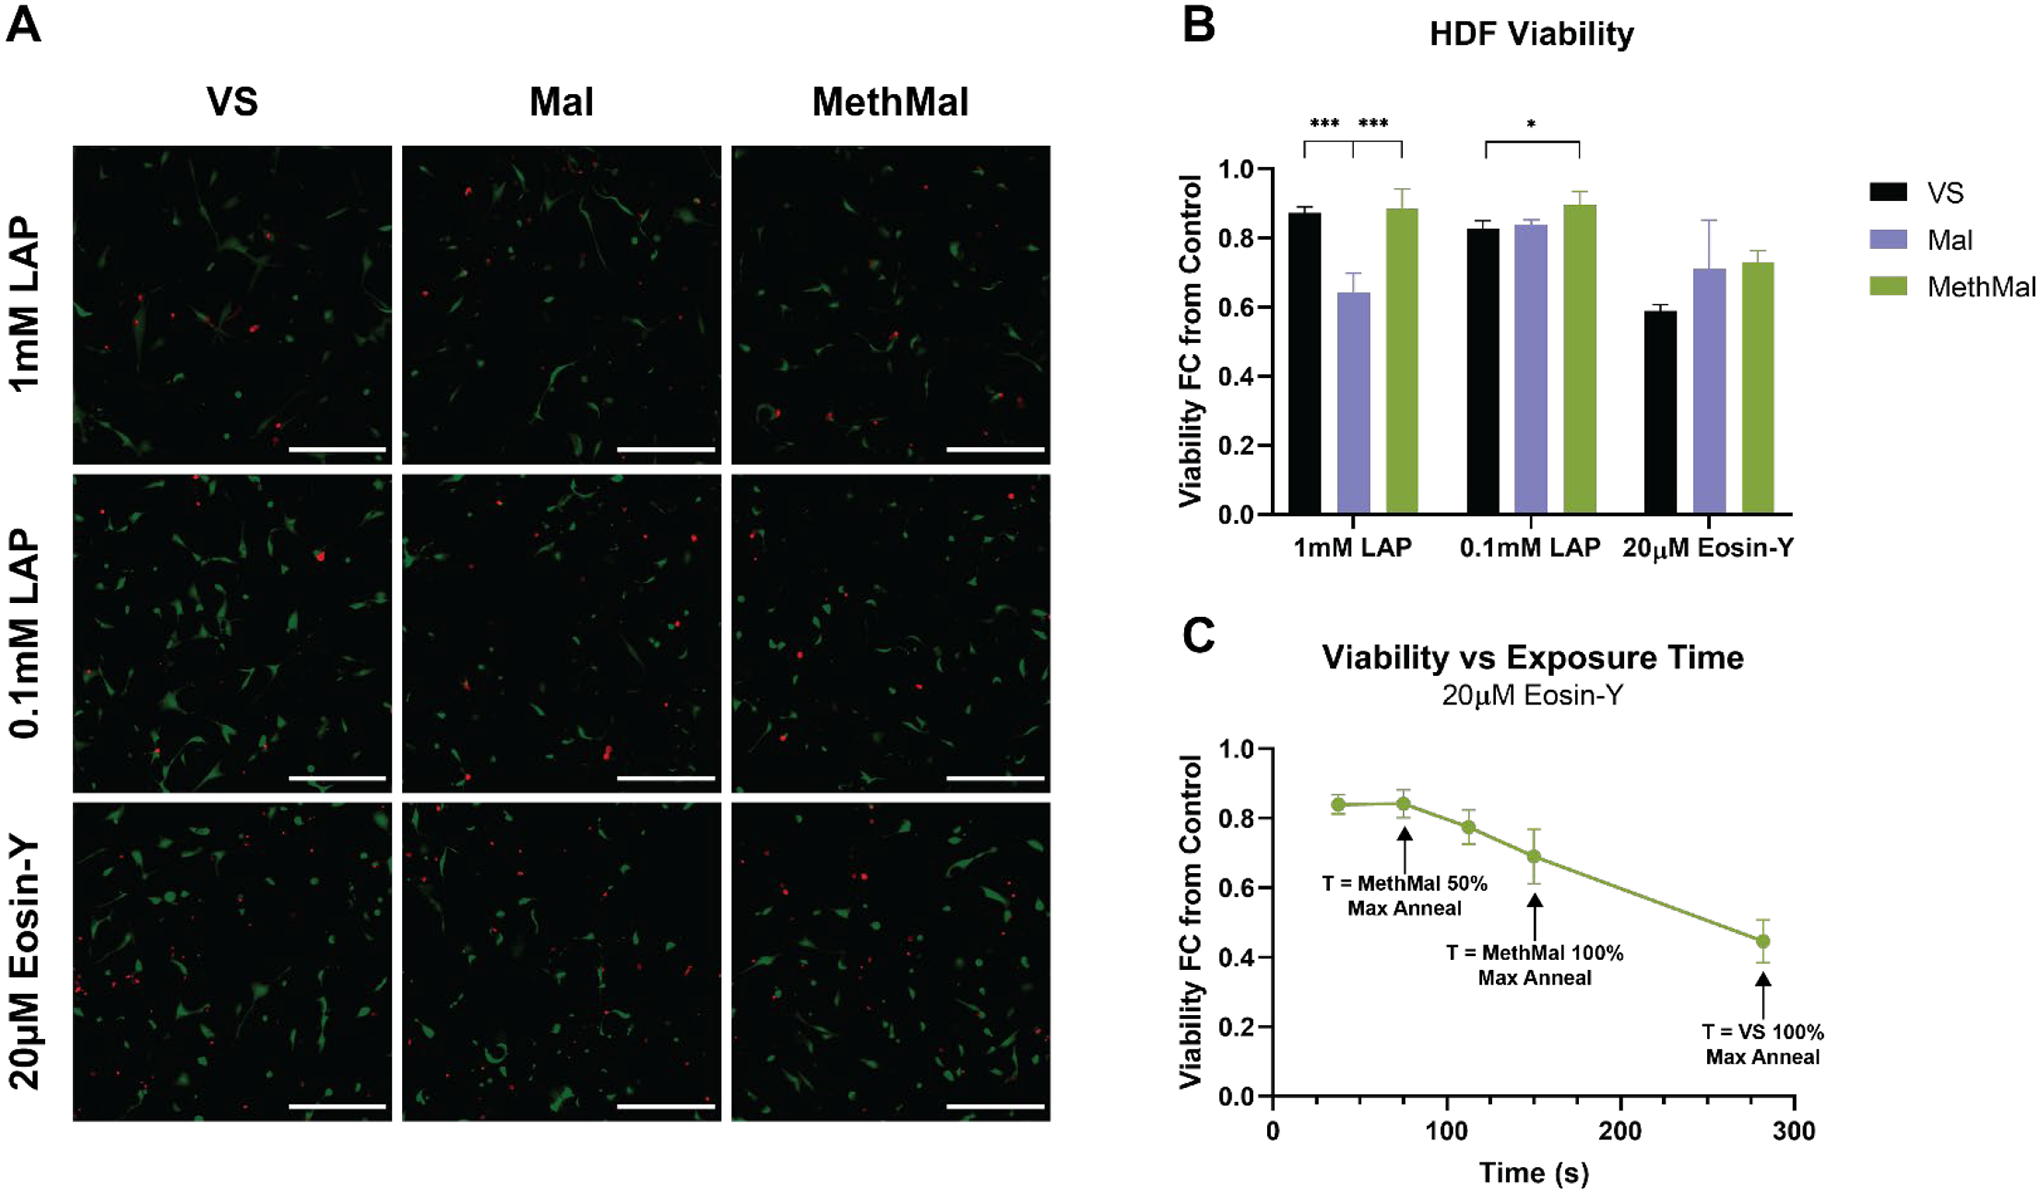
Figure 3.

Primary cell viability in response to annealing chemistries and photoinitiators. A) Representative maximum intensity projection (MIP) images from each condition showing both live (green) and dead (red) HDFs. Scale bar represents 300μm. B) HDF viability at 24 hours shown as a fold-change from 2D tissue culture plastic controls. C) HDF viability at 24 hours following culture in MethMal gel and annealed with 20μM Eosin-Y using a range of exposure times. All graphs show mean +/− standard deviation. One-way ANOVAs followed by post-hoc multiple comparison tests (Tukey HSD) were used to determine significance. *** p-value < 0.001, * p < 0.05.
