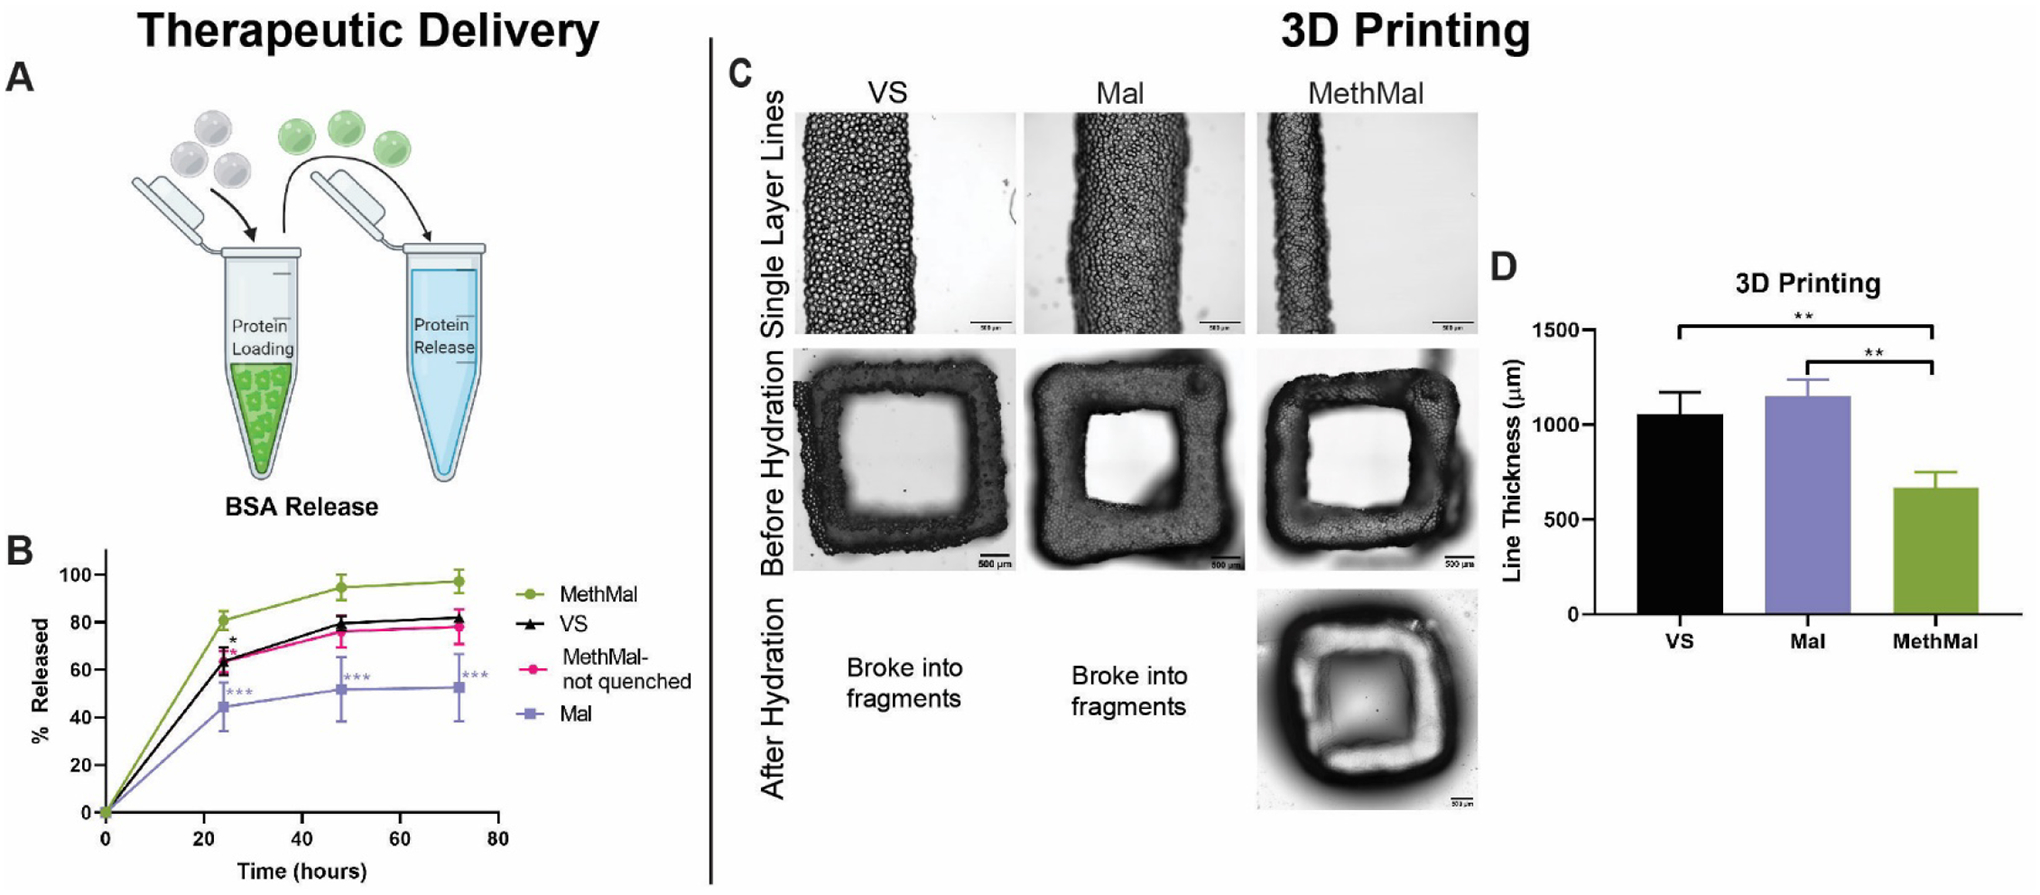
Figure 4.

Functional assays to compare annealing chemistries. A) BSA release was characterized by loading MAP particles with fluorescently tagged BSA and monitoring release in infinite sink conditions for 72 hours. B) Release profiles over 72 hours. C) 3D printing experiments consisted of printing single-layer lines and 5-layer squares and submerging them in PBS to test the quality of crosslinking. D) Line thickness was compared between groups to evaluate the kinetics of annealing. Scale bars represent 500μm. All graphs show mean +/− standard deviation. One-way ANOVAs followed by post-hoc multiple comparisons tests (Tukey HSD) were used to determine significance. *** p < 0.001, ** p < 0.01, * p < 0.05.
