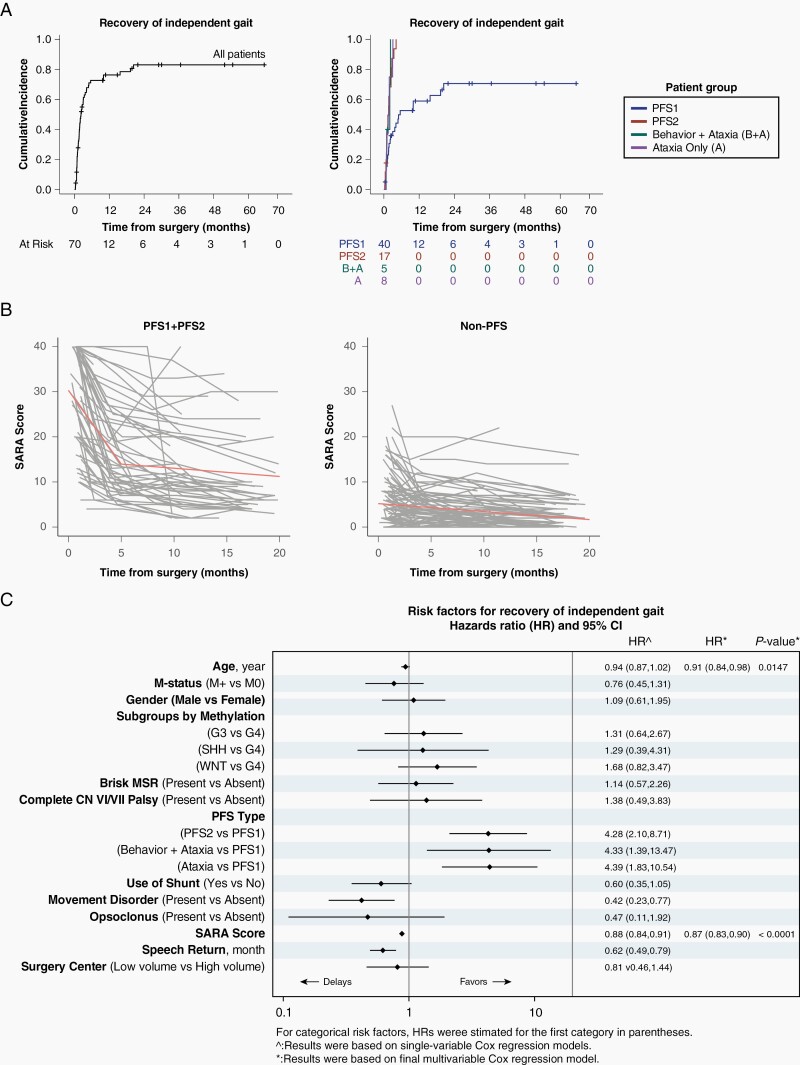
Fig. 2.
(A) Cumulative incidence plots showing recovery of independent gait in all 178 children and by different clinical subgroups. (B) Profile plots of scale for the assessment and rating of ataxia (SARA) scores in posterior fossa syndrome PFS1 + 2 cohort (n = 60) and non-PFS cohort (n = 118). A score of 0 is normal and 40 is inability to sit, speak, stand, and reach. Spikes represent children who developed treatment-related complications such as radiation necrosis. Orange straight lines represent fitted lines based on change-point linear mixed-effects model. (C) Risk factors for delayed recovery of independent gait.

