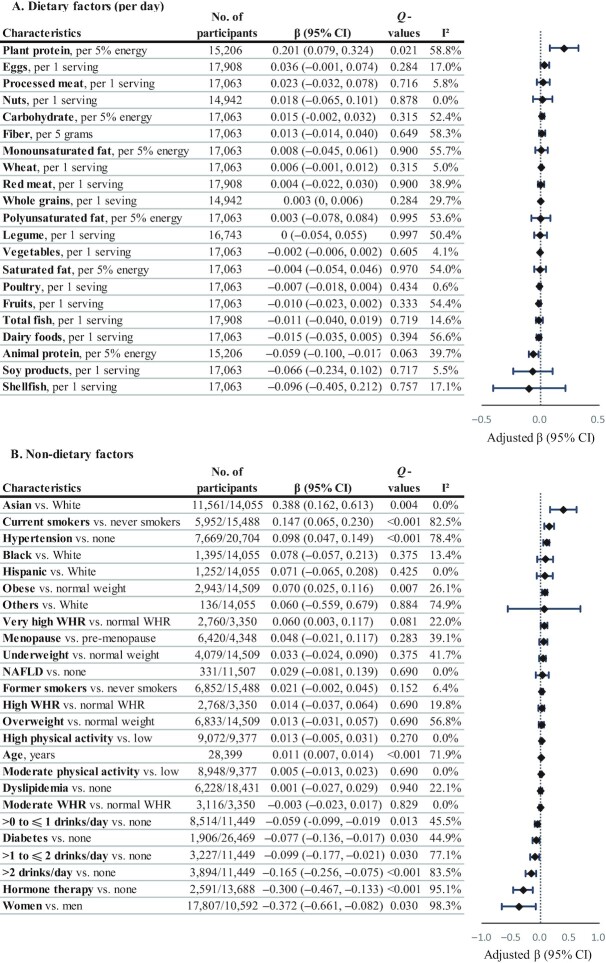
FIGURE 6.
Circulating DMG in relation to dietary (A) and nondietary (B) factors. Regression coefficients (β) and 95% CIs were adjusted for age; sex; ethnicity; fasting time; education; obesity; central obesity; smoking status; alcohol drinking; physical activity level; use of multivitamins; menopausal status and hormone therapy in women; intakes of red meat, eggs, and fish; history of diabetes, hypertension, dyslipidemia, and NAFLD; and total energy. Dietary covariates were mutually adjusted for other foods and included in the model as the cohort- and sex-specific quintiles. Total energy intake was additionally adjusted for in diet-related analyses. βs indicate the increase or decrease in SD units of DMG on the log scale. Q values represent corrected P values for each groups of analyses by controlling the false discovery rate. DMG, dimethylglycine; NAFLD, nonalcoholic fatty liver disease; WHR, waist-to-height ratio.

