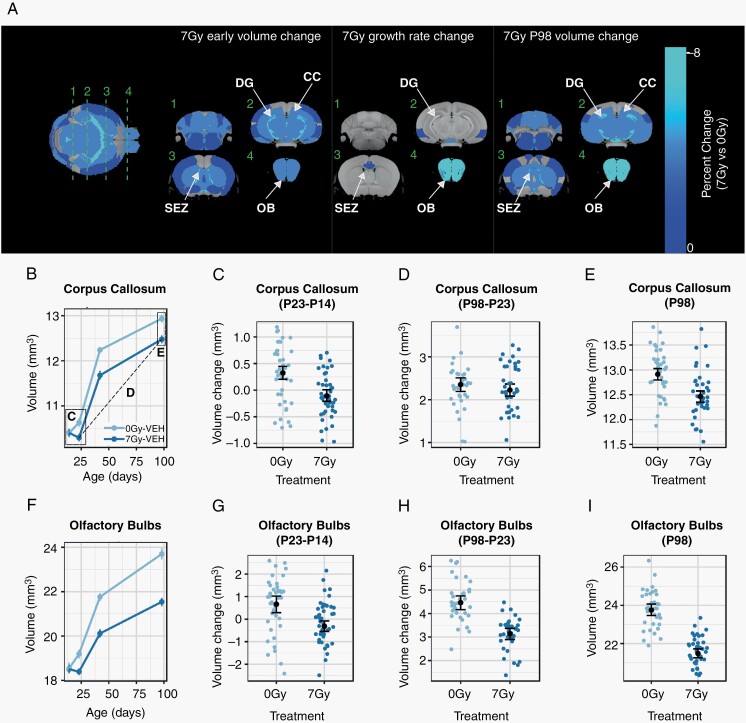
Fig. 2.
Widespread volume reduction in the mouse brain after irradiation at P16. In (A), an average in vivo MRI image is shown at left, with a color overlay indicating the early volume change (ie, the volume difference between 7 Gy and 0 Gy observed at P23) in all regions considered statistically significant (FDR <10%). Green lines indicate the location of orthogonal slices shown in the subsequent columns, which show the early volume change, the total change in growth rate over the post-irradiation (75-day) period, and the P98 change (ie, the difference between 7 Gy and 0 Gy observed at P98). Individual plots show the volume of the corpus callosum and olfactory bulbs over time (B, F), along with plots likewise demonstrating the early volume change as the volume change between P23 and P14 (C, G) and long-term volume change as the volume change between P98 and P23 (D, H). To visualize the endpoint volume outcomes, the final P98 volumes were plotted (E, I). Annotations in B indicate the relationships between the plots. The individual points in (B, F) and black means in (C–E, G–I) represent averages across sex. Points and error bars represent the mean volume and bootstrapped 95% confidence intervals. Smaller colored dots (C–E, G–I) represent structure volumes from individual mice. Abbreviations: 0 Gy, sham-treated; 7 Gy, irradiated; CC, corpus callosum; DG, dentate gyrus; OB, olfactory bulbs; SEZ, subependymal zone; VEH, vehicle-treated mice (ie, no metformin treatment).

