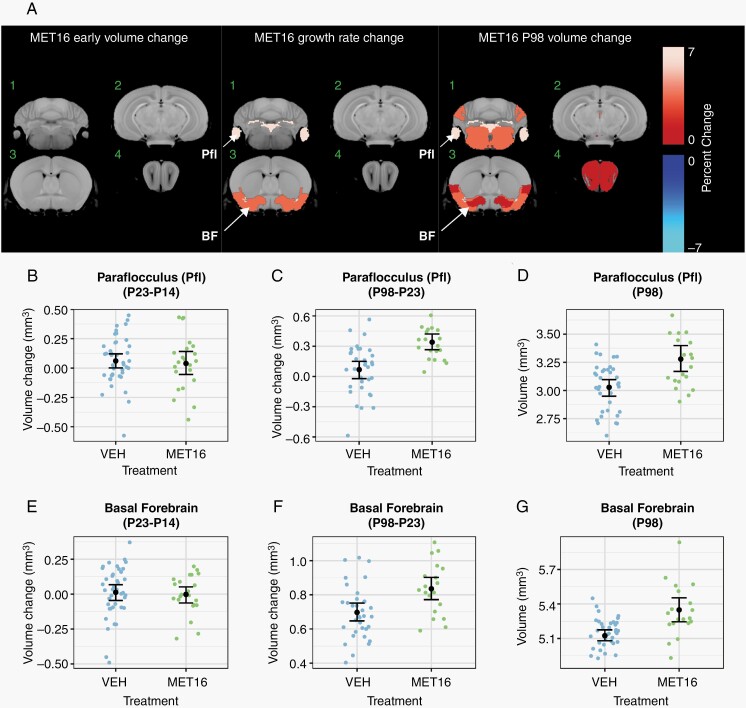
Fig. 3.
Increased growth during brain development due to metformin in unirradiated mice. In (A), a color map overlay shows all structures that had a significant volume difference in MET16-treated mice compared to vehicle-treated mice (FDR <10%). Slice positions in (A) match those in Figure 2. There was no effect of MET16 on the brain in 0-Gy mice at P23 (early). Subsequently, enhanced growth rate was observed in regions of the cerebellum, basal forebrain, and piriform cortex, leading to increased volumes by P98 (A). Representative plots of the paraflocculus (B–D) and basal forebrain (E–G) show no significant early volume change as visualized by the P23-P14 volume difference in (B, E). Growth rate and P98 change (A) is significantly increased in both structures, as shown by the P98-P23 volume differences (C, F). This results in increased volume by the final P98 time point (D, G). Treatment effects within the fitted model are represented as the average of males and females. Black points and error bars represent the mean volume and bootstrapped 95% confidence intervals. Smaller colored dots represent structure volumes from individual mice. Abbreviations: BF, basal forebrain; MET16, treated with metformin starting at P16, for 14 days; Pfl, paraflocculus.

