

Summary
Cation-chloride cotransporters (CCCs) regulate the movement of chloride across membranes, controlling physiological processes from cell volume maintenance to neuronal signaling. Human CCCs are clinical targets for existing diuretics and potentially additional indications. Here, we report the X-ray crystal structure of the soluble C-terminal regulatory domain of a eukaryotic potassium-chloride cotransporter, Caenorhabditis elegans KCC-1. We observe a core α/β fold conserved among CCCs. Using structure-based sequence alignment, we analyze similarities and differences to the C-terminal domains of other CCC family members. We find that important regulatory motifs are in less structured regions and residues important for dimerization are not widely conserved, suggesting oligomerization and its effects may vary within the larger family. This snapshot of a eukaryotic KCC is a valuable starting point for the rational design of studies of cellular chloride regulation.
Introduction
Electroneutral cation-chloride cotransporters (CCCs) use Na+ and/or K+ gradients to drive Cl− transport across cellular membranes and regulate a broad range of physiological processes, including cell volume maintenance, fluid secretion, and neuronal excitability. Although best studied in vertebrate species, CCCs are found in all domains of life (Hartmann et al., 2014; Warmuth et al., 2009). Dysfunction in Cl− transport can lead to disorders in humans, including hypokalemia and metabolic alkalosis, and the neurodegenerative disorder Andermanns syndrome (Gagnon and Delpire, 2013). Association of deletions or mutations of CCCs in mouse models with epilepsy, sickle cell disease, locomotor defects, neuropathy, hypertension, and hearing loss highlight the importance of this transporter family to basic physiological processes and its potential as a therapeutic target for many indications (Gagnon and Delpire, 2013). Clinically, CCCs are the targets of diuretics (including bumetanide and furosemide) prescribed for the treatment of hypertension and acute edema (Brater, 1998). Although these drugs have been widely prescribed for decades, we lack molecular mechanisms of inhibition because high-resolution structural information has not been available.
CCCs are solute carrier (SLC) transporters belonging to the amino acid/polyamine/organocation (APC) superfamily of secondary transporters. Humans have seven clearly identified homologous genes (SLC12A1–7) that comprise two major branches: the inward transporting Na+-dependent transporters (Na+-K+-Cl− Cotransporters NKCC1 and NKCC2, and the Na+-Cl− Cotransporter NCC) and the outward transporting Na+-independent transporters (K+-Cl− Cotransporters KCC1–4). In humans, NKCC1, KCC1, KCC3, and KCC4 are ubiquitously expressed whereas NCC and NKCC2 expression is restricted to the kidney and KCC2 is uniquely expressed in neuronal cells (Gagnon and Delpire, 2013). Characterizing the CCC family is an integral transmembrane domain (TMD) with 12 transmembrane-spanning helices and large intracellular N- and C-terminal domains (Figure 1A) (Chang et al., 2004; Park and Jr., 1996). The TMD contains the ion translocation path and diuretic binding site(s) (Delpire and Guo, 2020). The N-terminal domain (NTD) is the region with the greatest variability among paralogs and it has little predicted secondary structure. The NTD is involved in phosphoregulation of NKCCs whereas KCCs have phosphoregulatory residues in the C-terminal domain (CTD) (Kahle et al., 2010). The CTD is a mostly globular domain with a fold that is a unique identifier of CCCs (Warmuth et al., 2009). CCCs have been proposed to function as dimers with dimerization mediated by both the TMD and CTD but it is not clear how dimerization of either domain relates to transporter function (Hartmann and Nothwang, 2015). Additional features that distinguish the sequences of Na+-dependent from Na+-independent transporters, which include the location of extracellular loops, glycosylation sites, and regions of predicted disorder have been previously reviewed in detail (Hartmann and Nothwang, 2015; Hartmann et al., 2014).
Figure 1. The C-terminal domain of C. elegans KCC-1 adopts a fold similar to other chloride-cation transporters.
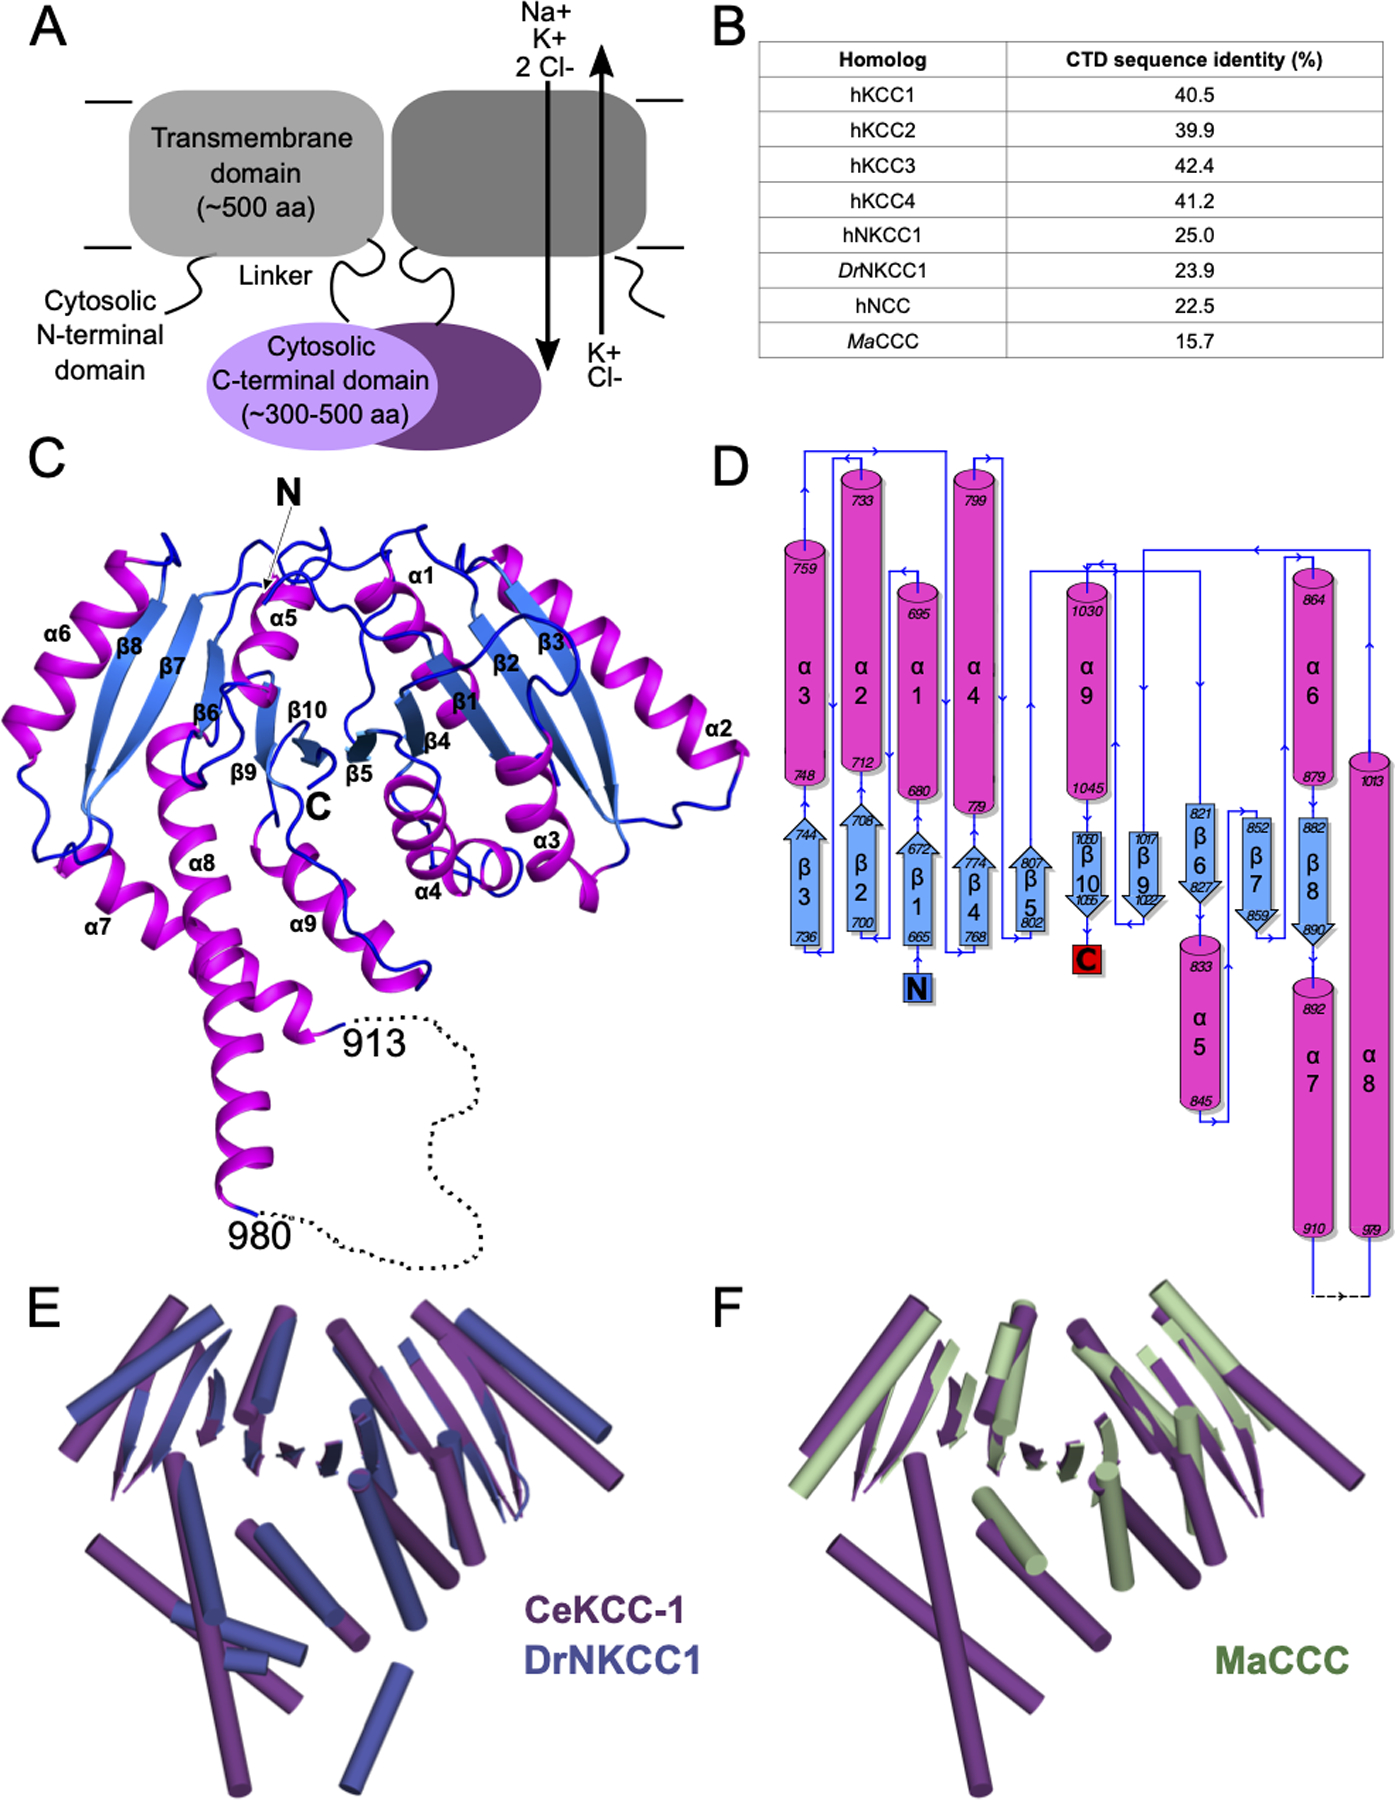
A) Schematic of the domain architecture of CCCs based on primary sequence. Approximate domain sizes are given as number of amino acids, with ranges varying between homologs. B) Sequence identity of the CeKCC-1 CTD to the indicated homologs (calculated from Clustal Omega alignment using the Blossum50 matrix). C) Ribbon diagram of the X-ray crystal structure of the C-terminal domain of CeKCC-1. A monomer comprising the asymmetric unit is shown, colored by secondary structure with β-strands in blue and α-helices in magenta. N- and C-termini and the topological ordering of strands and helices, corresponding to the numbering in panel D are labeled. The disordered regulatory loop is indicated by a dotted line with residue span indicated. N- and C-termini are labeled.The disordered regulatory loop is indicated by a dotted line with residue span indicated. N- and C-termini are labeled. D) Topology diagram for CeKCC-1 with secondary structural elements colored as in C) and residue ranges indicated. E) Structural alignment of CeKCC-1 CTD (purple) to DrNKCC1 CTD (blue, PBDID 6NPJ), in cartoon representation with helices as rods, strands as arrows and loops omitted. F) Structural alignment of CeKCC-1 CTD (purple) to MaCCC CTD (green, PDBID 3G40) represented as in E).
Cl− homeostasis is maintained over longer time scales through modulation of expression and localization of CCCs and over shorter time scales through post-translational modification of the NTD or CTD (Rinehart et al., 2009). Phosphoregulation appears to play a role in trafficking, membrane localization, and transport activity (Kaila et al., 2014). Best studied is the reciprocally coordinated regulation of NKCC1 and KCCs by the with-no-lysine (WNK) kinase pathway. WNKs activate the Ste20/Sps1-related proline/alanine-rich kinase (SPAK) and oxidative-stress responsive kinase 1 (OSR1). Phosphorylation by SPAK/OSR1 activates NKCC1 but inhibits KCCs providing an elegant mechanism to control intracellular [Cl−], which is vital for inhibitory GABAergic signaling in the brain (Rivera et al., 1999). Along with WNK/SPAK/OSR1, KCC2 is a known substrate of the Ca2+-dependent protein kinase C (PKC) (Lee et al., 2007) and the Ca2+-dependent protease calpain (Puskarjov et al., 2012; Zhou et al., 2012). How different modifications of the CTD influence the transport of ions through the TMD is not clear, in part because producing recombinant transporters in yields sufficient for biochemical studies has been a bottleneck in the field (Agez et al., 2017; Bergeron et al., 2011). Recently, significant advances have been made in the production and structure determination of CCC family members providing the first snapshots that will allow us to unravel such details (Agez et al., 2017; Bergeron et al., 2011; Chew et al., 2019; Liu et al., 2019).
Here we present the atomic resolution structure of the isolated regulatory CTD of the KCC-1 transporter from Caenorhabditis elegans. We compare this structure to two previously determined structures of CTDs of other CCCs. We find conservation of a core fold but identify differences in homo-dimerization for distantly related family members. We observe conserved sites of KCC phosphoregulation, allowing us to hypothesize structural consequences of phosphorylation. From this structure we propose that regulation of CCCs will be primarily mediated by protein-protein interactions.
Results
The C-terminal domain of C. elegans KCC-1 adopts a fold common to other chloride-cation transporters
To obtain an atomic resolution structure of a regulatory domain of a cation-chloride transporter, we screened the CTDs of multiple eukaryotic homologs for expression and solution behavior amenable to crystallization. We obtained crystals that diffracted to high resolution for the CTD of the C. elegans KCC-1 (CeKCC-1) transporter, one of three known KCCs in C. elegans (Holtzman et al., 1998; Tanis et al., 2009; Yoshida et al., 2016). Although C. elegans KCCs do not have clear human orthologs (Tanis et al., 2009), the CeKCC-1 CTD has significant sequence identity with the four human KCCs (Figure 1B) and serves as a model for the general family of mammalian KCC transporters.
Using two constructs, differing only in the purification tag (as detailed in the methods section), we obtained two distinct crystal forms (Table 1). Both diffracted to high resolution and have a single chain in the asymmetric unit. The C2 crystal form was used for experimental phasing but electron density was not observed for a contiguous stretch of 104 amino acids and we subsequently found that the protein had been proteolyzed during crystallization. The P3212 crystals formed from intact protein and additional ordered residues are visible in the electron density (additional details are described in the methods section). The two models are otherwise similar, thus the P3212 model was used for subsequent analysis and figure generation. Our final model is built using data extending to 2.2 Å resolution (Table 1). The CeKCC-1 CTD adopts an α/β topology with a central ten-stranded β-sheet, comprising a five-stranded inverted repeat, plus associated α-helices and loops (Figure 1C,D). The core of this topology is similar to that seen in the structures of the CTDs of two other CCCs that have been previously reported: one, the X-ray crystal structure of the isolated CTD from the archaeal species Methanosarcina acetivorans (MaCCC) (Warmuth et al., 2009) and the second, a cryo-electron microscopy (cryo-EM) structure of the full length NKCC1 transporter from zebrafish (DrNKCC1) (Chew et al., 2019). All three structures share the same ten-stranded β-sheet core. Pairwise superposition of main-chain atoms in the central β-sheet (calculated using PyMol (Schrödinger, LLC, 2015)) gives an RMSD of 1.26 Å between MaCCC and CeKCC-1 (over 205 atoms) and 0.94 Å between DrNKCC1 and CeKCC-1 (over 195 atoms). Variability is observed in the helix and loop architecture surrounding the β-sheet (Figure 1E,F).
Table 1.
X-ray Data Collection and Refinement Statistics
| Data set | Native construct A | I− soaked construct A | Native construct B |
|---|---|---|---|
| Crystallization buffer | 0.1 M TRIS pH 8.5, 5% PEG 8000, 20% w/v PEG 300, 10% glycerol | 0.2 M LiAcetate, 20% w/v PEG 3350 | 0.1 M HEPES pH 7.5, 50% w/v PEG 200 |
| Beamline | APS 24-ID-C | Home source | ALS 8.2.2 |
| Data collection | |||
| Wavelength (Å) | 0.97910 | 1.54 | 0.99 |
| Resolution (Å)a | 40.0–1.80 (1.86–1.80) | 50.0–3.20 (3.26–3.20) | 50.0–2.20 (2.28–2.20) |
| Space group | C2 | C2 | P3212 |
| Unit cell parameters | |||
| a,b,c (Å) | 104.320, 65.546, 56.523 | 103.590, 66.654, 57.133 | 75.647, 75.647, 146.865 |
| α, β, γ (°) | 90.000, 97.174, 90.000 | 90.000, 97.343, 90.000 | 90.000, 90.000, 120.000 |
| No. of observationsa | 325595 (29973) | 21201 (703) | 135496 (13246) |
| Unique reflectionsa | 34639 (3193) | 6424 (306) | 24878 (2448) |
| Redundancya | 9.4 (9.4) | 3.3 (2.4) | 5.4 (5.4) |
| Anom redundancya | - | 1.7 (1.3) | - |
| Completenessa | 97.87 (91.01) | 99.6 (93.3) | 99.9 (99.71) |
| Anom completenessa | - | 99.0 (85.5) | - |
| Average<I>/<σI>a | 13.83 (0.73) | 24.9 (8.3) | 10.4 (0.51) |
| Wilson B-factor | 43.20 | 35.29 | 37.93 |
| Rsyma,b | 0.072 (2.854) | 0.038 (0.077) | 0.182 (3.4) |
| CC1/2a | 0.999 (0.454) | 0.994 (0.963) | 0.995 (0.476) |
| CC*a,c | 1.0 (0.79) | 0.998 (0.991) | 0.999 (0.803) |
| Refinement | |||
| Resolution | 40.0 – 1.80 | - | 50.0 – 2.20 |
| Number of reflections | 34610 | - | 24861 |
| Reflections used for Rfree | 1717 | - | 1152 |
| Rwork/Rfree (%)d | 18.26/21.45 | - | 18.17/22.26 |
| Number of atoms | 2531 | - | 2734 |
| Protein atoms | 2430 | - | 2595 |
| Water | 67 | - | 92 |
| Ligands (PEG/EG) | 40 | - | 47 |
| Average B-factors | |||
| Protein | 66.84 | - | 53.24 |
| Water | 61.17 | - | 52.53 |
| Ligands(PEG/EG) | 89.24 | - | 69.98 |
| Root-mean-square deviations | |||
| Bond lengths | 0.015 | - | 0.008 |
| Bond angles | 1.42 | - | 1.16 |
| Ramachandran plot (%) | |||
| Favored | 98.98 | - | 98.12 |
| Allowed | 1.02 | - | 1.88 |
| Outliers | 0.0 | - | 0.0 |
| TLS groups | 3 | - | 3 |
| PDBID | 6VW9 | - | 6VWA |
Values in parentheses are for the highest-resolution shell
Rsym=(∑hkl∑i∣Ii(hkl)−<I(hkl)>∣)/(∑hkl∑iIi(hkl))
CC* = (2CC1/2/(1+CC1/2))1/2
R = ∑||Fo| - |Fc||/∑||Fo|| where Fo and Fc denote observed and calculated structure factors, respectively.
CeKCC-1 CTD crystallized with one chain in the asymmetric unit and analysis of the crystal packing revealed three potential dimer interfaces. Two of these interfaces orient the N-terminal residues of each chain, which must attach to their respective TMDs, on the same face of the molecule (Figure 2A). These candidate dimers, that we call dimer A and dimer B, bury a similar accessible surface area (1362 vs. 1301 Å2) and both are stabilized by salt-bridge, hydrogen-bonding, and hydrophobic interactions. Dimer A was observed in both crystal forms and dimer B was observed only in the P3212 crystal form. Neither dimer is similar to that observed for MaCCC (Figure 2B), but dimer A is similar to that observed for DrNKCC1 (Figure 2C). The DrNKCC1 dimer uses the same face of the CTD for dimerization but is stabilized only by van der Waals interactions and the relative orientation of the two protomers is shifted slightly (Figure 2D).
Figure 2. Oligomerization interface of CTDs is variable.
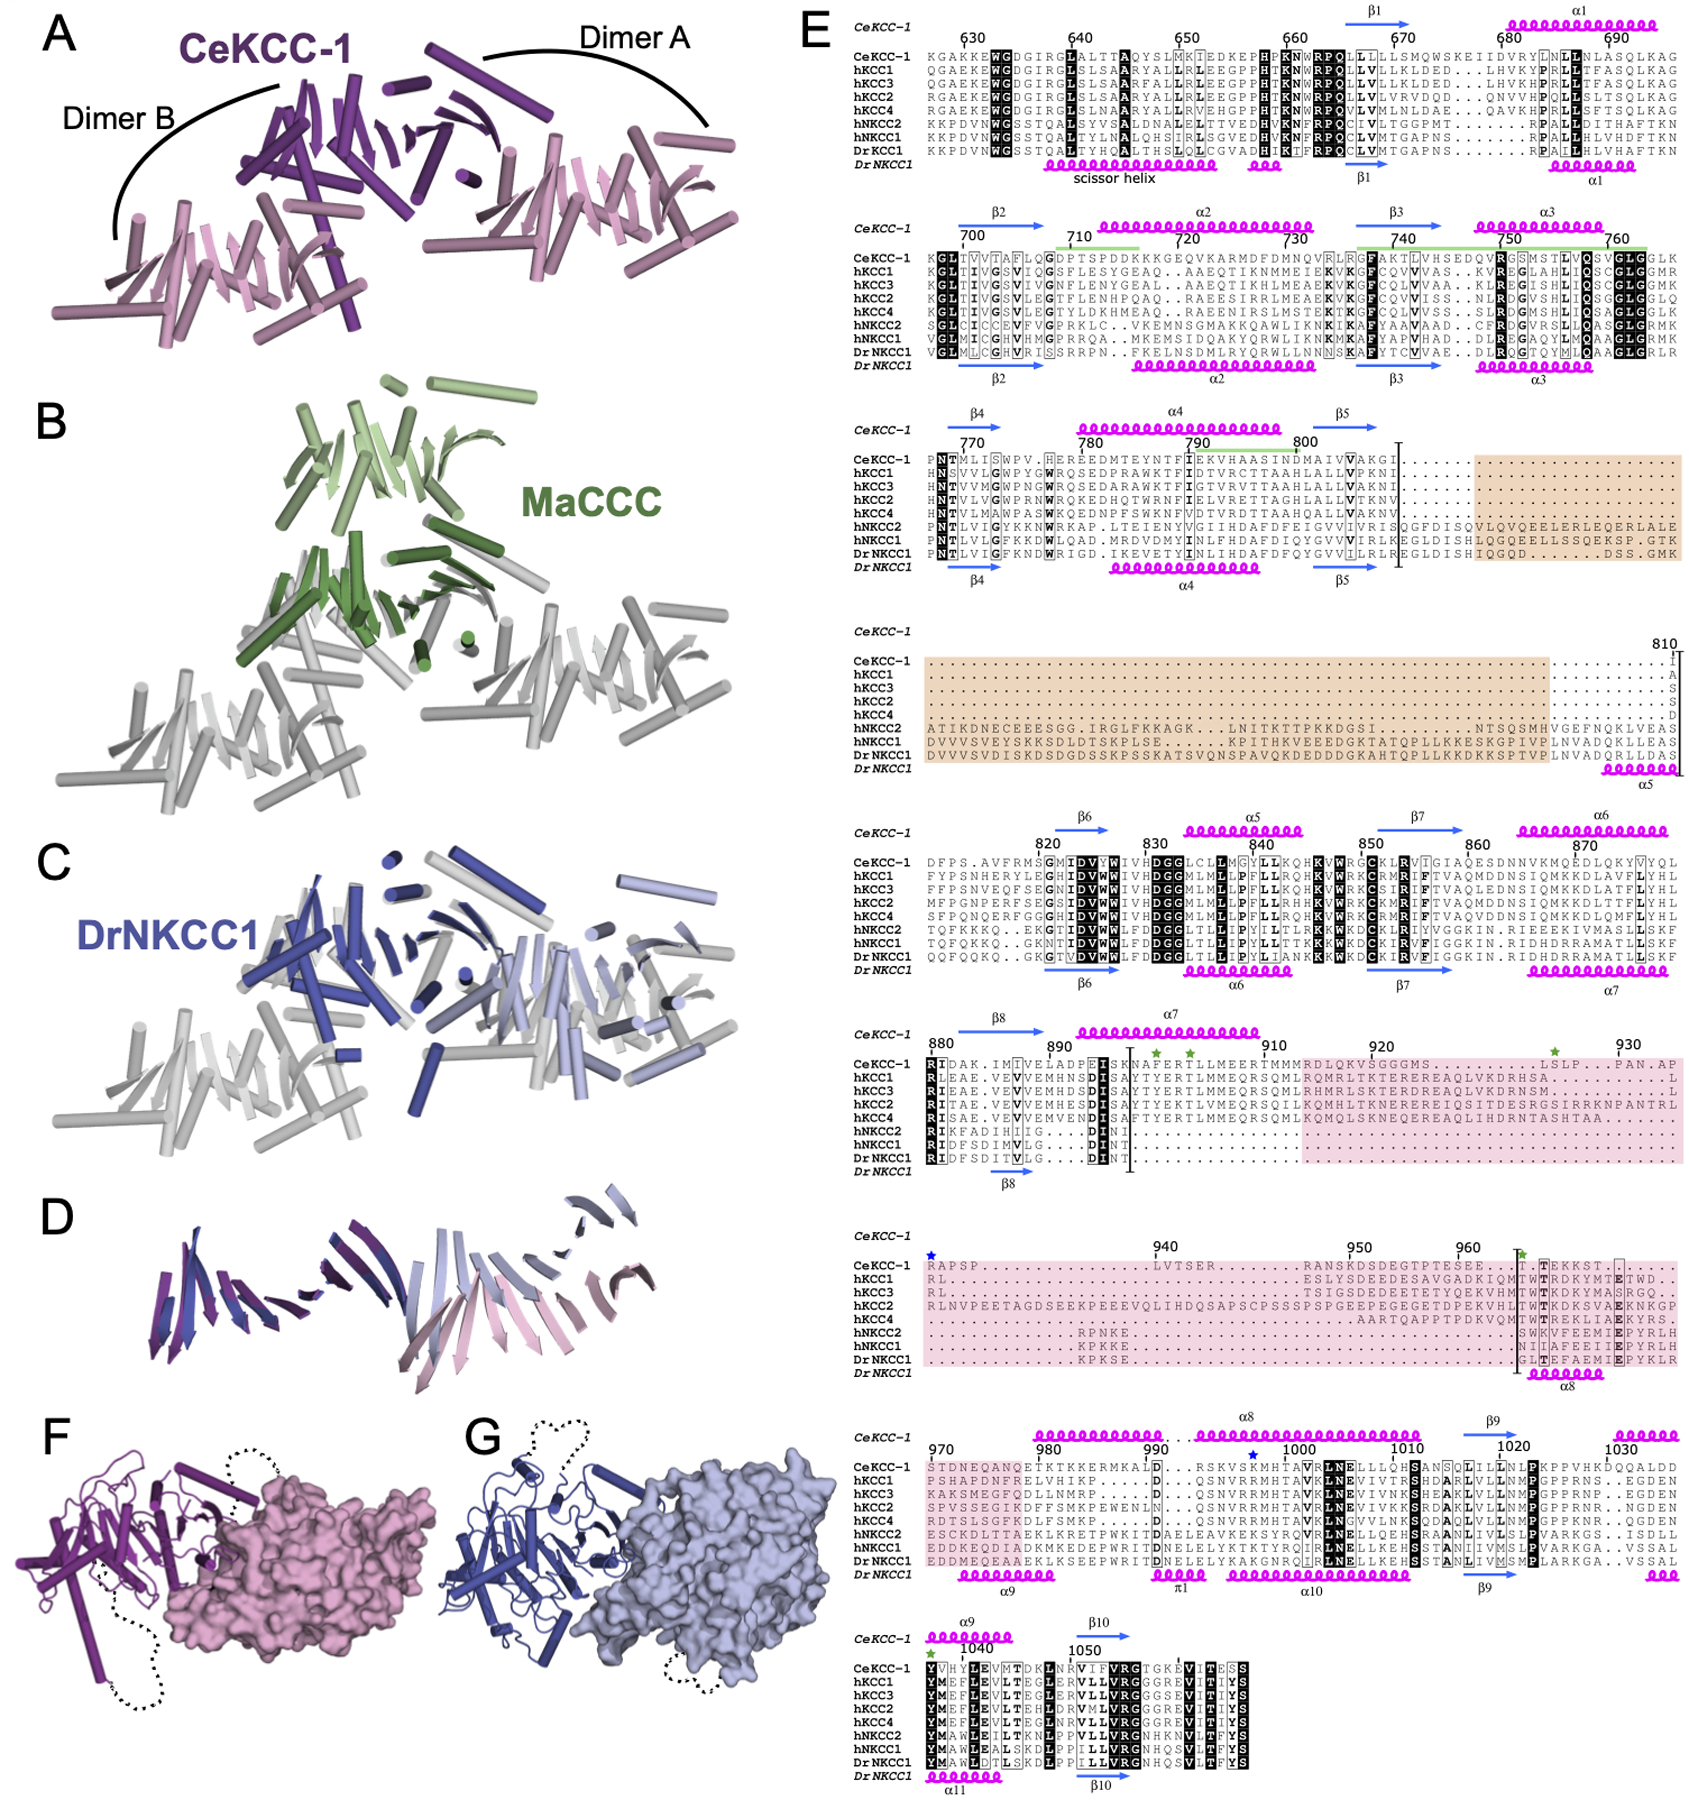
A)CeKCC-1 monomer is shown in purple with two crystallographic dimer partners shown in light pink. Two possible dimers are labeled as dimer A and dimer B. B) The three CeKCC-1 chains shown in A) are now colored grey with the central monomer aligned to the MaCCC monomer as in Fig. 1F. The biochemically validated MaCCC dimer partner is shown in light green. C) The three CeKCC-1 chains are shown in grey as in B) with the central monomer aligned to a DrNKCC1 monomer as in Fig. 1E. The DrNKCC1 dimer partner observed by cryo-EM is colored light blue. The first α-helix of the DrNKCC1 construct (“scissor helix”) that was not included in the CeKCC-1 construct is omitted for clarity. D) Representation of the β-strands only for the common CeKCC-1 and DrNKCC1 dimer shown in C) highlighting that the relative orientation of the two chains in the dimer is not identical. E) Structure based sequence alignment of the C-terminal domains of the two eukaryotic CCC homologs of known structure with human (N)KCC transporters. Secondary structure, confirmed by DSS analysis (Kabsch and Sander, 1983), is indicated for CeKCC-1 (above alignment) and DrNKCC1 (below alignment) with β-strands in blue and α-helices in magenta. Identical residues are highlighted in black, similar residues are in boxes with consensus residues in bold font. The CeKCC-1 homodimerization interface is indicated with green bars. Sites of phosphorylation in mammalian KCCs are indicated with green stars and sites of epilepsy-associated mutations found in hKCC2 are indicated with blue stars. Boundaries of sequence insertions that differentiate the Na+-dependant vs. -independent transporters are highlighted with black bars. Regions that are not observed in crystal structures are highlighted with tan or pink boxes (for DrNKCC1 and CeKCC-1 respectively). Residue numbering for full length CeKCC-1 is used and indicated above the alignment. F) CeKCC-1 dimer with one chain in cartoon representation and the second chain shown in surface representation. Disordered segments are indicated with dotted lines. G) DrNKCC1 dimer represented as in F).
Regions of sequence variability between chloride-cation paralogs are structurally flexible
In our structure-based sequence alignment of CCC homologs, the Na+-dependent and Na+-independent transporters can be distinguished by the location of long sequence insertions (Figure 2E, regions between black lines). KCCs have an insertion between β8 and β9 and NKCCs have an insertion between β5 and β6. In our CeKCC-1 maps, we see no electron density for residues 913–979 of the KCC insertion (Figure 2E, pink box) and similarly, in the published structure of the DrNKCC1 CTD, the residues between β5 and β6 were not modeled (Figure 2E, tan box). These insertions are located on opposite faces of the central β-sheet (Figure 2F,G). The KCC insertion contains multiple residues involved in regulation via phosphorylation (Figure 2E, green stars) whereas phosphoregulation of NKCC’s mainly occurs through the NTD (Kahle et al., 2010).
The 66 disordered, and thus unmodeled, residues in CeKCC-1 are bounded by helices α7 and α8, which extend away from the core of the protein and are stabilized by crystal contacts (Figures 1C, 3B). Analysis using the DISOPRED3 disorder prediction method implemented in the PSIPRED server, predicts the unmodeled residues to be disordered with high confidence (>90%) (Buchan and Jones, 2019; Jones and Cozzetto, 2015). In our attempts to purify other KCC homolog CTDs, there was a strong correlation between the length of sequence between α7 and α8 and protein aggregation during purification. Notably, in our C2 crystal form, these helices are not involved in crystal packing and α7 and part of α8 are not observed in the electron density, indicating that their ordering is not required to maintain the core fold.
Figure 3. CeKCC-1 isolated C-terminal domain is a dimer in solution that can be disrupted by single amino acid substitutions made at an observed crystallographic dimer interface.
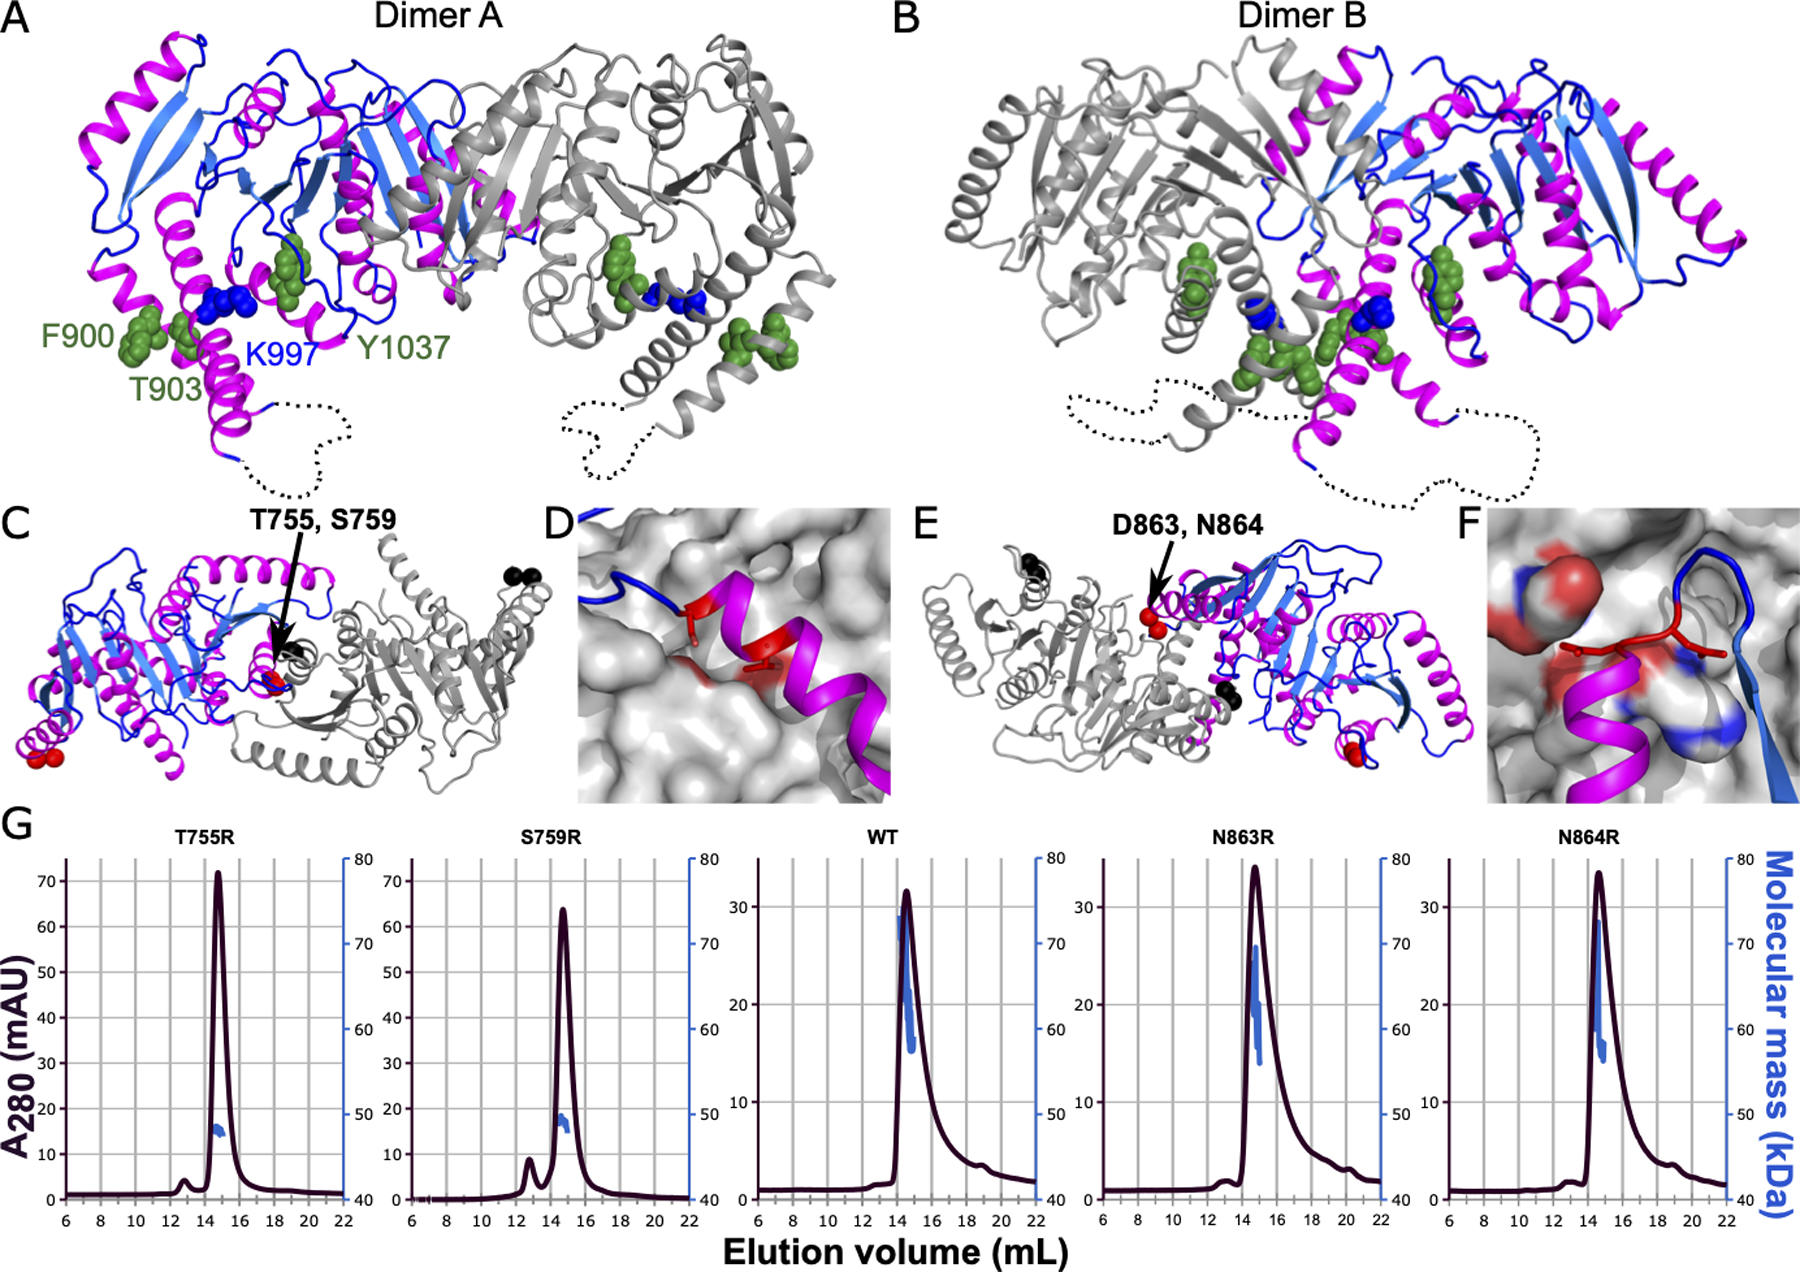
Two dimer interfaces observed in the crystal lattice are shown in A) and B). One chain is colored as in Figure 1 and the second chain is colored grey. Residues homologous to known phosphorylation sites and epilepsy-associated mutations are shown in spheres and colored green and blue respectively. C) Dimer A is shown looking top down from the orientation in A. The Cαs of substituted residues are highlighted as spheres (red in one chain and black in the dimer partner chain). The dimer A interface was probed with T755R or S759R substitutions, labeled. D) Zoomed in view of the residues substituted to probe the dimer A interface. Substituted side chains are shown as sticks and colored red. The chain colored grey is shown in surface representation with atoms within 5 Å of the substituted side chains colored by atom type (carbons in grey, oxygens in red, nitrogens in blue). E) Dimer B is shown looking top down from the orientation in B. Representation is as in panel C. The dimer B interface was probed with N864R or D863R substitutions. F) Zoomed in view of the residues substituted to probe the dimer B interface, represented as in D. G) SEC/MALS traces for the wild type and four single amino acid substitutions are shown. A280 is plotted against the left y-axis and traces colored dark purple. Molecular mass calculated from MALS is plotted against the right y-axis and traces colored blue. The x-axis and right y-axis are identical for all five traces, but left y-axis varies, as indicated.
The isolated C. elegans KCC-1 C-terminal domain dimerizes in solution
During purification we observed that CeKCC-1 CTD elutes from a size exclusion column at a molecular weight consistent with a dimer when compared to globular molecular weight standards. Whereas dimer A is similar to that observed for the DrNKCC1 (Figure 3A), dimer B brings known phosphorylatable and epilepsy-associated residues into close proximity (Figure 3B). As we might expect the consequences of phosphorylation to be different depending on the relative locations of those sites within a dimer, we wanted to distinguish which of these potential dimers is the one observed in solution. We identified two amino acid residues in contact at each interface and substituted them for bulkier side chains (T755R, S759R for dimer A: N864R, D863R for dimer B) (Figure 3C–F), hypothesizing disruption of a bone fide dimer. We expressed and purified the four single amino acid substituted constructs and analyzed their solution behavior by SEC/MALS (Figure 3G). Molecular weight estimation from light scattering shows the WT, N863R, and N864R proteins are a polydisperse population that is likely a mix of dimers and monomers at the concentration tested (40 μM) whereas the T755R and S759R proteins were both monodisperse with a molecular weight consistent with a monomer (46 kDa). This result is consistent with dimer A being the more relevant dimer and points to a common dimerization interface for KCCs and NKCCs (Figure 2C).
This CeKCC-1 dimer has a buried surface area of 1362 Å2 (7.6% of the total surface area). The interface has a moderate shape complementarity, with a measured Sc value of 0.572 (Sc values are a shape correlation score that range from 0–1) (Lawrence and Colman, 1993). The interface has a neutral electrostatic charge (Figure 4A) and is stabilized by salt-bridge, hydrogen-bonding, and van der Waals interactions. A salt bridge is observed between D709 and K1029, although neither of these residues is conserved among KCCs or NKCCs (Figure 2E, regions at the interface shown with green lines). Of the eight hydrogen bonds that stabilize the observed dimer, only two involve a highly conserved residue. The side chain of Q758, which is conserved across the CCC family, forms H-bonds to the backbone amide and carbonyl oxygen of V743. The hydroxyl groups of S759 and its dimer partner are at H-bonding distance at the interface. S759 is conserved among KCCs but corresponds to a conserved Ala in NKCCs. Other residues involved in hydrogen bonding (S752, T755, K716, K740, Q748, and N799) are not conserved. The interface is formed by residues of α3, β3, α3, and α4 (Figure 2E, green lines, Figure 4A). The topology in this region appears to be conserved across CCCs, providing a common scaffold while variation in the sequences may result in variability in the details of dimerization for different transporters.
Figure 4. Conserved phosphoregulatory sites are found in multiple structural environments.
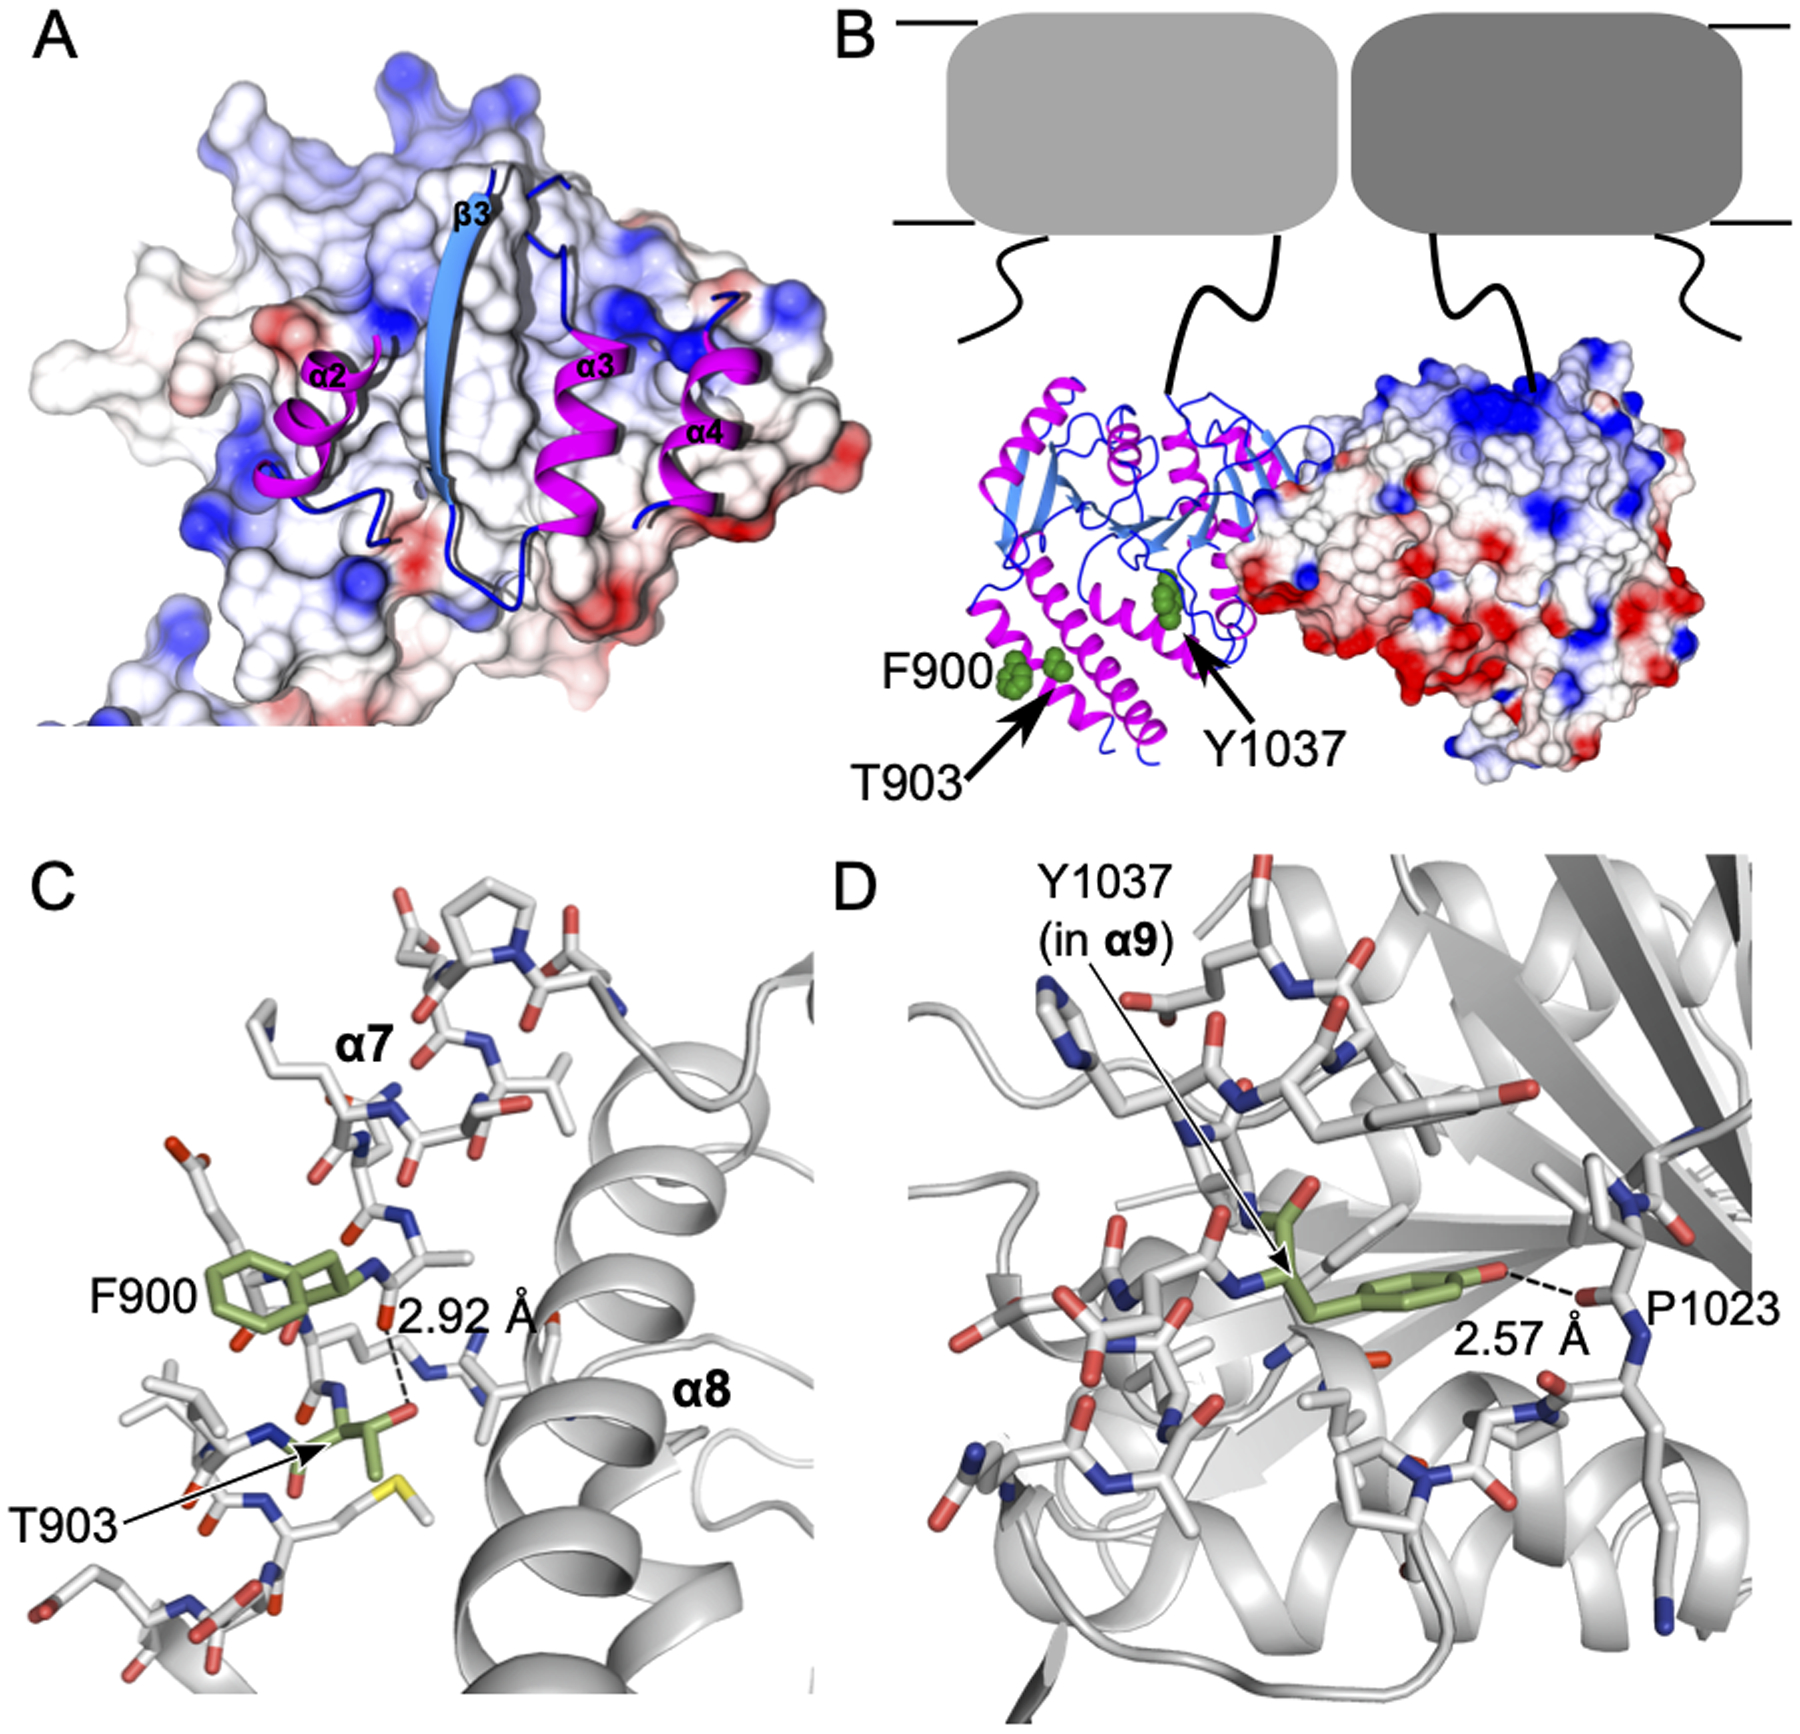
A) A close up view of the dimer A interface. Interface residues are shown as ribbons for one chain (with secondary structure numbered as in Figure 1) and the dimer partner chain is shown in surface representation colored by electrostatic charge as calculated in CCP4MG (Winn et al., 2011). B) The full dimer, represented as in A is shown with a predicted orientation relative to the TMD, shown in grey cartoon as in Figure 1A. hKCC phosphoregulatory residues F900, T903 and Y1037 are highlighted with green spheres and labeled. C) The local environment of F900 and T903 is shown. Helix 7 and residues within 4 Å of F900/T903 are shown as sticks. Carbons of F900/T903 are colored green with all other carbons in grey, oxygen in red, nitrogen in blue, and sulfur in yellow. F900 (a conserved tyrosine in hKCCs) is exposed to solvent, whereas T903 hydrogen bonds to a backbone carbonyl oxygen. D) Representation as in panel C for Y1037. Helix 9 and residues within 4 Å of Y1037 are shown as sticks. Y1037 hydrogen bonds to a backbone carbonyl oxygen of a neighboring loop. H-bonds are indicated with dashed lines with measured distances given.
Conserved phosphoregulatory sites are found in multiple structural environments
A number of conserved phosphorylation sites in the CTD of KCCs control Cl− transport activity. This regulation is best studied in the neuronally expressed KCC2 where phosphorylation of threonine or tyrosine residues reduces Cl− transport activity (Moore et al., 2017). Mechanistic studies have shown that KCC2 activity can be regulated through residence time of transporters in the plasma membrane, implicating interactions with trafficking proteins as a major effect of (de)phosphorylation (Gamba, 2005; Kahle et al., 2013). It is less clear if there is also direct communication of phosphorylation state to the TMD. Four phosphorylation sites conserved among all human KCCs are identifiable in the CeKCC-1 sequence: F900, T903, T963, and Y1037 (Figure 2E, blue stars). Of these, we observe F900, T903, Y1037 (respectively Y903, T906, Y1087 in hKCC2b) in our CeKCC-1 CTD structure. All three residues are on a face of the protein that is predicted, based on orientation of the N-termini and homology to DrNKCC1, to be distal from the TMD (Figure 4B). The side chain of F900, homologous to tyrosine in all human KCCs, is exposed on the surface of the protein, thus phosphorylation should not significantly affect the overall structure observed in this state (Figure 4C). Conversely, the side chains of T903 and Y1037 hydrogen bond to backbone carbonyl oxygens (to A899 and P1023 respectively), stabilizing buried conformations (Figure 4D). Phosphorylation at either site is not compatible with the structure we observe here; moreover, side chain rotations alone would not suffice to expose these hydroxyl groups. This indicates that significant structural change is required for phosphorylation and may also be the basis for identification by interaction partners. F900 and T903 are found on α7, just upstream of the larger disordered region (Figure 2E, pink box). As described above, this helix is disordered in one of our two crystal forms, indicating flexibility of this region under some conditions. We generated and crystallized T903E and T963E phosphomimetic constructs hoping we might observe a distinct conformational state. The T963E construct crystallized only in already identified conditions for which solved structures showed no ordering of the region containing this residue. The T903E construct crystallized only in conditions of the C2 crystal form where α7 is not ordered and not observable. For T903E, we verified these crystals were in fact the C2 crystal form and we could not observe residue 903 by solving a structure from these crystals. Because this structure was otherwise identical to the wildtype, we did not refine it further.
Discussion
Understanding how cellular [Cl−] is regulated by CCCs is necessary to develop interventions targeting intracellular [Cl−] for both therapeutic and basic research purposes. Mechanistic details of both transport and regulation for CCCs have been incomplete, partly due to a lack of high-resolution structural information. The recently reported cryo-EM structures of DrNKCC1 and human KCC1 are harbingers of an increased rate of progress in unraveling these molecular details for this family of proteins (Chew et al., 2019; Liu et al., 2019). Our structure provides an atomic-resolution look at the cytosolic regulatory domain of a eukaryotic KCC. In the structure of human KCC1, the CTD was not resolved (Liu et al., 2019) but comparison of the CeKCC-1 CTD to that of a eukaryotic NKCC and the distantly related MaCCC CTD allows us to make hypotheses about the mechanisms of CCC regulation by phosphorylation and oligomerization.
The structure of the CeKCC-1 CTD confirms a conserved CTD core fold for both Na+-dependent and -independent CCCs. The ten-stranded β-sheet is a scaffold on which subtype-specific functionality is built. For eukaryotic transporters, a common mode of oligomerization is mediated by the same face of the N-terminal half of the CTD. The C-terminal half of the CTD, in contrast, includes regions of disorder but the location of these regions relative to the core differentiates NKCCs from KCCs (Figure 2E–G). For KCCs the disordered region of the CTD is involved in post-translational regulation whereas in NKCCs phosphoregulation is mediated by the NTD (Kaila et al., 2014). The mechanisms of phosphoregulation are clearly unique, and the disordered region in KCCs may be important in additional regulatory pathways. Experiments measuring FRET between reporters genetically encoded in the CTD of NKCC1 correlated large intermolecular conformational changes with transport activity, suggesting that activation is correlated with monomer-dimer transitions of the CTD (Monette and Forbush, 2012). Detailed studies linking KCC activation to oligomerization have not been reported. The physical separation of the oligomerization interface and regulatory elements (either distally within the CTD or in the NTD) makes the connection between monomer-dimer transitions and transporter activity unclear. In the cryo-EM structure of DrNKCC1, the CTD was found to be flexible relative to the TMD (Chew et al., 2019). In the cryo-EM structure of full-length human KCC1, the CTD was not resolvable to a resolution sufficient to build a molecular model (Liu et al., 2019). This suggests the CTD is flexible relative to the TMD or does not have a stable dimerization interface and adopts multiple conformations.
The dimer we observe of the isolated CeKCC-1 CTD buries a significant surface area and is stabilized by multiple interactions, but can be disrupted with single amino acid substitutions. Functional characterization of full length CeKCC-1with these substitutions is needed to illuminate the relevance of this finding. A lack of conservation at this interface, particularly for hydrogen-bonding residues, suggests that CTD affinity may vary in different homologs. This is supported by comparison of the homodimerization interface of DrNKCC1. Although the same face of the CTD with conserved secondary structure is used to form a dimer, the interface does not overlap exactly (Figure 2D). Whereas CeKCC-1 has multiple hydrogen bonding and salt bridge interactions, the DrNKCC1 dimer interface has no stabilizing hydrogen bonds. Further, the dimer of the isolated CTD from MaCCC, which was validated using site directed mutagenesis and crosslinking (Warmuth et al., 2009), is distinctive from those of eukaryotic CCCs (Figure 2B). It is likely that the role of oligomerization in regulating CCCs is distinct for distantly related transporters.
An important distinction between the CeKCC-1 and DrNKCC1 structures is that the latter is derived from a full-length construct and has ordered density for an α-helical linker between the end of the TMD and start of the CTD, termed the “scissor”-helix which was not included in our crystallized construct. This protomer-swapped helix contributes a significant buried surface area to the DrNKCC1 dimer. The scissor helix makes predominantly van der Waals interactions with the CTD and the most highly conserved amino acids within the scissor helix are hydrophobic, however these conserved residues are not at the scissor helix-CTD interface. We generated a construct of the CeKCC-1 CTD that includes this helix. This construct crystallized in the same C2 crystal form observed for construct A and diffracted to 2.3 Å resolution. It also crystallized in a new crystal form that diffracted to 6.3 Å resolution, also in space group C2 but with 14 copies in the asymmetric unit. We were able to solve both structures using molecular replacement, however no electron density was found for the scissor helix in any copy. It appears that the TMD stabilizes its position in the full length transporter. As these models were not significantly different than our existing model, we did not refine them further. Structurally, the scissor helix appears poised to physically communicate regulation signals in the CTD to the transporter but how its interactions with the CTD, the transporter domain, and potential interactions with the NTD change under different conditions and how this can affect transport activity requires further investigation and may be different for different family members.
Because of the observed correlation of NKCC activity with large structural changes in the CTD, the observation of a crystallographic dimer that brought known phosphoregulatory residues in close proximity provided an attractive model for a direct physical connection of phosphorylation and homodimerization. Our SEC/MALS analysis of interface disrupting substitutions however does not support oligomerization via this interface, at least not in solution. Whether this interface could be relevant in the context of a full-length transporter or confined in the 2D environment of a plasma membrane requires further exploration.
Our structure also allows us to make some hypotheses about mechanisms of transporter phosphoregulation via the CTD that may not be mediated by changes in oligomerization. Particularly interesting are T903 and Y1037. T903 is a conserved SPAK substrate in human KCCs and its phosphorylation would destabilize α7. This is unlikely to destabilize the core of the protein. Y1037 is conserved in all CCCs, and is part of a canonical tyrosine phosphorylation motif in KCC2 and KCC4 although the identity of the physiological kinase is not known (Strange et al., 2000). Mutation of this residue in KCC1 and KCC2 has been shown to affect transporter activity in heterologous systems (Strange et al., 2000) while for KCC2 it has been shown that phosphorylation of this residue leads to lysosomal degradation of the transporter (Lee et al., 2010). Y1037 of CeKCC-1 is located on α9 and reaches into a hydrophobic pocket where it is stabilized by a hydrogen bond with the backbone carbonyl of P1023 (also a conserved residue) (Figure 4D). This orientation is not compatible with the addition of a phosphoryl group, suggesting a large conformational change that may destabilize the core fold of the protein. The remaining residues involved in post-translational regulation are exposed or within regions of the protein disordered in this state, where they may rely on partner proteins to effect regulation. CCCs are known to interact with kinases, phosphatases, cytoskeletal proteins, and other integral membrane receptors (Gamba, 2005; Mahadevan et al., 2017). From the structures available thus far, it is clear that these interactions are vital to controlling cellular Cl− transport mediated by CCCs.
In conclusion, from a comparison of the structures of the CTD of an NKCC and KCC, we hypothesize that the molecular details of transport regulation may be unique for Na+-dependant and Na+-independent transporters, and perhaps even unique between KCC subtypes. Additional structures and biochemical studies are needed to determine if and how the NTD and CTD communicate with the TMD or other binding partners to affect transport function. Detailed mechanisms of transporter function and regulation remain to be determined, but the structure of the CeKCC-1 CTD contributes to a growing body of atomic resolution data illuminating how CCCs are regulated.
STAR Methods
LEAD CONTACT AND MATERIALS AVAILABILITY
Further information and requests for resources and reagents should be directed to and will be fulfilled by the Lead Contact, Christina Zimanyi (czimanyi@nysbc.org).
EXPERIMENTAL MODEL AND SUBJECT DETAILS
All protein constructs described in this study were purified after heterologous expression in Spodoptera fugiperda (Sf9) cells grown in ESF921 protein-free medium at 27°C (Expression Systems)
METHOD DETAILS
Cloning, expression and purification
The CeKCC-1 sequence was obtained from the NCBI database (Reference Sequence: NM_001306919.2). The C-terminal domain boundary was defined based on homology to the CCC from the prokaryote M. acetivorans, for which a structure has been reported (PDBID 3G40). A gene fragment for the C-terminal domain of CeKCC-1 comprising residues 661–1066 was purchased from Integrated DNA Technologies with the CTD sequence flanked by appropriate sequences for insertion into expression vectors using ligation independent cloning (LIC) methods (Aslanidis and de Jong, 1990). Genes were ligated into the pFastBac baculovirus expression vector with an N-terminal deca-histidine tag, followed by a SUMO(star) fusion (Liu et al., 2008) followed by a TEV protease sequence. All point mutants were made using the QuikChange method with the wildtype constructs as a template. Open reading frames of all plasmids were fully sequence verified by Sanger sequencing.
Following the MultiBac method (Trowitzsch et al., 2010), bacmid DNA was prepared from the EMBacY E. coli strain transformed with the pFastBac-His10-SUMO(star)-TEV-CTD vector. Baculovirus was produced by transfection of isolated bacmid DNA into Spodoptera fugiperda Sf9 cells, and propagated in Sf9 cells grown in ESF 921 protein-free medium (Expression Systems). Protein was expressed in Sf9 cells grown in shaker flasks at 27°C to a density of 4×10⁶/mL and infected with baculovirus at a high multiplicity of infection. Cells were harvested after 72 h of expression and flash frozen in liquid nitrogen (LN2). Thawed cells were lysed by sonication in lysis buffer (20 mM tris(hydroxymethyl)aminomethane (Tris), 150 mM NaCl, 60 mM imidazole, 1 mM tris(2-carboxyethyl)phosphine (TCEP), 5 mM 4-(2-aminoethyl)benzenesulfonyl fluoride hydrochloride (AEBSF), pH 7.6), lysate was cleared by centrifugation then filtered before purification on an AKTAxpress system using a 1 mL Ni-NTA affinity column followed by a Superdex 200 16/60 gel filtration column. The His10-SUMO(star) tag was cleaved by TEV protease (Blommel and Fox, 2007). Our initial construct design (construct A) had slow TEV cleavage, requiring overnight incubation to go to completion, so a modified construct (construct B) was generated using the QuikChange method to introduce an additional glycine-serine spacer between the TEV protease sequence and the first residue of the CTD. TEV cleavage of construct B went to completion in 2–3 h at room temperature. Upon completion of the cleavage reaction, TEV, cleaved SUMO(star) and uncleaved protein was removed by flowing over Ni-NTA resin and the cleaved CTD was further purified by ion exchange using a MonoQ column followed by a Superdex 200 10/30 column.
Crystallization & X-ray data collection
Protein in gel filtration buffer (20 mM Tris, 150 mM NaCl, 1 mM TCEP pH 7.6) was concentrated to 8.0 mg/mL for crystallization. Crystals were grown by the vapor diffusion method, mixing protein with well solution at a 1:1 ratio (with final volumes ranging from 100–200 nL) over a reservoir of 60 μL well solution in an ArtRobbins 3-well Intelliplate (Art Robbins) using an NT8 Drop Setter (Formulatrix). Initial hits of similar morphology were obtained in multiple conditions of sparse matrix screens at both 25°C and 4°C.
Crystals of construct A appeared in 0.1 M Tris pH 8.5, 5% PEG 8K, 20% PEG 300, 10% glycerol at 25°C after 5–8 days and were harvested after 20 days by looping directly from the crystallization drop and plunging into LN2. A native data set was collected at APS beamline 24-ID-C to 1.80 Å resolution (Table 1). Crystals of construct A also grew in 0.2 M lithium acetate and 20% polyethylene glycol (PEG) 3350 at 4°C. These crystals appeared after 5–8 days. After 17 days, crystals were soaked with iodine during cryoprotection by placing crystals in a solution 20 mM Tris pH 7.5, 0.22 M lithium acetate, 22% PEG 3350, 25% ethylene glycol, and 1.0 M KI for 30s before plunge freezing in LN2. To obtain experimental phase information, a full data set was collected on these crystals on our home source Rigaku Micromax 007-HF X-ray generator (with X-ray wavelength of 1.54 Å) and a Rigaku Saturn 944 CCD detector (Table 1).
Construct B also crystallized in multiple conditions in sparse matrix screens. Crystals grew in 0.1 M 4-(2-hydroxyethyl)-1-piperazineethanesulfonic acid (HEPES) pH 7.5, 50% PEG 200, appearing after 1–2 days and were harvested after 17 days, by looping directly from the crystallization drop and plunging into LN2. A full native data set was collected to 2.2 Å resolution at ALS beamline 8.2.2 (Table 1).
Structure determination and refinement
Diffraction data were processed using HKL2000 and the CCP4 suite (Otwinowski and Minor, 1997; Winn et al., 2011). Initial phases were obtained in the AutoSol module of Phenix (Adams et al., 2010) using the native and KI soak data sets of the slow cleaving construct by SIRAS. Twelve I− sites were found and refined with a FOM of 0.439, leading to interpretable electron density maps after solvent flattening. ARP/wARP and Buccaneer (Cowtan, 2006; Langer et al., 2008) were used for automated model building and the final model was manually adjusted and refined iteratively using Coot (Emsley et al., 2010) and PhenixRefine, respectively. We modeled 299 of the 405 residues included in the construct, with the longest contiguous stretch of disorder seen between residues 892–996. SDS-PAGE analysis of these crystals, indicated that proteolysis of the construct had occurred during crystallization that contributed to at least some of the missing electron density. Construct B formed crystals of a distinct crystal form and SDS-PAGE analysis of these crystals showed the protein remained intact over the course of crystallization. The structure of construct B was solved by molecular replacement in Phaser (McCoy et al., 2007), using the model from construct A as a search model. This new crystal form had additional density for residues not observed for the proteolyzed construct. The model was manually adjusted and iteratively refined using Coot and PhenixRefine, respectively. We modeled 325 of the 407 residues included in the construct, with the longest contiguous stretch of disorder seen between residues 912–980. Although the protein remains intact, a contiguous stretch of 68 residues remain disordered, consistent with a propensity of this region for proteolysis. Refinement of both models consisted of rounds of positional and B-factor refinement with TLS restraints used in later rounds. TLS groups were determined automatically in PhenixRefine. Structure figures were made using the PyMOL Molecular Graphics System (Schrödinger, LLC, 2015) and CCPMG (Winn et al., 2011). Final refinement statistics are shown in Table 1.
AUC/SEC-MALS
Single amino acid substituted constructs were purified as described above but without a MonoQ purification step after TEV cleavage. Concentrated protein was diluted into running buffer (TRIS 20 mM, NaCl 150 mM, TCEP 1 mM, pH 7.6) to a concentration of 40 μM, spun at 20000xg for 30 min at +4°C and transferred to new tubes. 100 μL were injected onto a Superdex 200 10/30 GL Increase column (GE Healthcare), connected to an Akta chromatography system, eluted in running buffer at 0.5 ml/min and room temp. UV at 280 nm was measured with the Akta system detector, the RI and light scattering data was collected with an Optilab T-rEX RI detector (Wyatt Technology) and a Dawn Heleos II scattering detector (Wyatt Technology), respectively. Molecular weights were calculated from RI and light scattering data using the Astra 6.1 software (Wyatt Technology).
Sequence alignments
Sequence alignments were performed using Clustal omega and adjusted manually using a structure based alignment of CeKCC-1 and DrNKCC1. The alignment figure was generated using ESPript3 (Robert and Gouet, 2014) and edited manually based on secondary structure verification using DSSP (Kabsch and Sander, 1983; Touw et al., 2015). The protein topology figure was generated using PDBsum and manually edited for consistency with other figures (Laskowski et al., 2018).
DATA AND CODE AVAILABILITY
The coordinates and structure factors for the CeKCC-1 CTD construct A (proteolyzed protein) and construct B (intact protein) have been deposited in the Protein Data Bank under ID codes 6VW9 and 6VWA, respectively.
Acknowledgments
This work was supported by a grant from the Simons Foundation/SFARI (Grant Number 599650, D.H.). This work is based upon research conducted at Beamline 8.2.2 of the Advanced Light Source, a DOE Office of Science User Facility under Contract No. DE-AC02-05CH11231, is supported in part by the ALS-ENABLE program funded by the National Institutes of Health, National Institute of General Medical Sciences, grant P30 GM124169-01. Beamline 8.2.2 is part of The Berkeley Center for Structural Biology, supported in part by the Howard Hughes Medical Institute. This work is based upon research conducted at the Northeastern Collaborative Access Team beamlines, which are funded by the National Institute of General Medical Sciences from the National Institutes of Health (P30 GM124165). The Pilatus 6M detector on 24-ID-C beam line is funded by a NIH-ORIP HEI grant (S10 RR029205). This research used resources of the Advanced Photon Source, a U.S. Department of Energy (DOE) Office of Science User Facility operated for the DOE Office of Science by Argonne National Laboratory under Contract No. DE-AC02-06CH11357. We thank Goran Ahlsen for collecting SEC/MALS data.
Footnotes
Declaration of Interests
The authors declare no competing interests.
References
- Adams PD, Afonine PV, Bunkoczi G, Chen VB, Davis IW, Echols N, Headd JJ, Hung L-W, Kapral GJ, Grosse-Kunstleve RW, et al. (2010). PHENIX : a comprehensive Python-based system for macromolecular structure solution. Acta Crystallogr. D Biol. Crystallogr 66, 213–221. [DOI] [PMC free article] [PubMed] [Google Scholar]
- Agez M, Schultz P, Medina I, Baker DJ, Burnham MP, Cardarelli RA, Conway LC, Garnier K, Geschwindner S, Gunnarsson A, et al. (2017). Molecular architecture of potassium chloride co-transporter KCC2. Sci. Rep 7, 16452. [DOI] [PMC free article] [PubMed] [Google Scholar]
- Aslanidis C, and de Jong PJ (1990). Ligation-independent cloning of PCR products (LIC-PCR). Nucleic Acids Res. 18, 6069–6074. [DOI] [PMC free article] [PubMed] [Google Scholar]
- Bergeron MJ, Boggavarapu R, Meury M, Ucurum Z, Caron L, Isenring P, Hediger MA, and Fotiadis D (2011). Frog oocytes to unveil the structure and supramolecular organization of human transport proteins. PLoS ONE 6. [DOI] [PMC free article] [PubMed] [Google Scholar]
- Blommel PG, and Fox BG (2007). A combined approach to improving large-scale production of tobacco etch virus protease. Protein Expr. Purif 55, 53–68. [DOI] [PMC free article] [PubMed] [Google Scholar]
- Brater DC (1998). Diuretic Therapy. N. Engl. J. Med 339, 387–395. [DOI] [PubMed] [Google Scholar]
- Buchan DWA, and Jones DT (2019). The PSIPRED Protein Analysis Workbench: 20 years on. Nucleic Acids Res. 47, W402–W407. [DOI] [PMC free article] [PubMed] [Google Scholar]
- Chang AB, Lin R, Studley WK, Tran CV, and Saier MH Jr (2004). Phylogeny as a guide to structure and function of membrane transport proteins (Review). Mol. Membr. Biol 21, 171–181. [DOI] [PubMed] [Google Scholar]
- Chew TA, Orlando BJ, Zhang J, Latorraca NR, Wang A, Hollingsworth SA, Chen D-H, Dror RO, Liao M, and Feng L (2019). Structure and mechanism of the cation–chloride cotransporter NKCC1. Nature 572, 488–492. [DOI] [PMC free article] [PubMed] [Google Scholar]
- Cowtan K (2006). The Buccaneer software for automated model building. 1. Tracing protein chains. Acta Crystallogr. D Biol. Crystallogr 62, 1002–1011. [DOI] [PubMed] [Google Scholar]
- Delpire E, and Guo J (2020). Cryo-EM structures of Dr NKCC1 and hKCC1: a new milestone in the physiology of cation-chloride cotransporters. Am. J. Physiol.-Cell Physiol 318, C225–C237. [DOI] [PMC free article] [PubMed] [Google Scholar]
- Emsley P, Lohkamp B, Scott WG, and Cowtan K (2010). Features and development of Coot. Acta Crystallogr. D Biol. Crystallogr 66, 486–501. [DOI] [PMC free article] [PubMed] [Google Scholar]
- Gagnon KB, and Delpire E (2013). Physiology of SLC12 transporters: lessons from inherited human genetic mutations and genetically engineered mouse knockouts. Am. J. Physiol. Cell Physiol 304, C693–714. [DOI] [PMC free article] [PubMed] [Google Scholar]
- Gamba G (2005). Molecular Physiology and Pathophysiology of Electroneutral Cation-Chloride Cotransporters. Physiol. Rev 85, 423–493. [DOI] [PubMed] [Google Scholar]
- Hartmann A-M, and Nothwang HG (2015). Molecular and evolutionary insights into the structural organization of cation chloride cotransporters. Front. Cell. Neurosci 8. [DOI] [PMC free article] [PubMed] [Google Scholar]
- Hartmann AM, Tesch D, Nothwang HG, and Bininda-Emonds ORP (2014). Evolution of the cation chloride cotransporter family: Ancient origins, gene losses, and subfunctionalization through duplication. Mol. Biol. Evol 31, 434–447. [DOI] [PubMed] [Google Scholar]
- Holtzman EJ, Kumar S, Faaland CA, Warner F, Logue PJ, Erickson SJ, Ricken G, Waldman J, Kumar S, and Dunham PB (1998). Cloning, characterization, and gene organization of K-Cl cotransporter from pig and human kidney and C. elegans. Am. J. Physiol.-Ren. Physiol 275, F550–F564. [DOI] [PubMed] [Google Scholar]
- Jones DT, and Cozzetto D (2015). DISOPRED3: precise disordered region predictions with annotated protein-binding activity. Bioinformatics 31, 857–863. [DOI] [PMC free article] [PubMed] [Google Scholar]
- Kabsch W, and Sander C (1983). Dictionary of protein secondary structure: Pattern recognition of hydrogen-bonded and geometrical features. Biopolymers 22, 2577–2637. [DOI] [PubMed] [Google Scholar]
- Kahle KT, Rinehart J, and Lifton RP (2010). Phosphoregulation of the Na–K–2Cl and K–Cl cotransporters by the WNK kinases. Biochim. Biophys. Acta BBA - Mol. Basis Dis 1802, 1150–1158. [DOI] [PMC free article] [PubMed] [Google Scholar]
- Kahle KT, Deeb TZ, Puskarjov M, Silayeva L, Liang B, Kaila K, and Moss SJ (2013). Modulation of neuronal activity by phosphorylation of the K–Cl cotransporter KCC2. Trends Neurosci. 36, 726–737. [DOI] [PMC free article] [PubMed] [Google Scholar]
- Kaila K, Price TJ, Payne JA, Puskarjov M, and Voipio J (2014). Cation-chloride cotransporters in neuronal development, plasticity and disease. Nat. Rev. Neurosci 15, 637–654. [DOI] [PMC free article] [PubMed] [Google Scholar]
- Langer G, Cohen SX, Lamzin VS, and Perrakis A (2008). Automated macromolecular model building for X-ray crystallography using ARP/wARP version 7. Nat. Protoc 3, 1171–1179. [DOI] [PMC free article] [PubMed] [Google Scholar]
- Laskowski RA, Jabłońska J, Pravda L, Vařeková RS, and Thornton JM (2018). PDBsum: Structural summaries of PDB entries. Protein Sci. 27, 129–134. [DOI] [PMC free article] [PubMed] [Google Scholar]
- Lawrence MC, and Colman PM (1993). Shape complementarity at protein/protein interfaces. J. Mol. Biol 234, 946–950. [DOI] [PubMed] [Google Scholar]
- Lee HHC, Walker JA, Williams JR, Goodier RJ, Payne JA, and Moss SJ (2007). Direct protein kinase C-dependent phosphorylation regulates the cell surface stability and activity of the potassium chloride cotransporter KCC2. J. Biol. Chem 282, 29777–29784. [DOI] [PubMed] [Google Scholar]
- Lee HHC, Jurd R, and Moss SJ (2010). Tyrosine phosphorylation regulates the membrane trafficking of the potassium chloride co-transporter KCC2. Mol. Cell. Neurosci 45, 173–179. [DOI] [PMC free article] [PubMed] [Google Scholar]
- Liu L, Spurrier J, Butt TR, and Strickler JE (2008). Enhanced protein expression in the baculovirus/insect cell system using engineered SUMO fusions. Protein Expr. Purif 62, 21–28. [DOI] [PMC free article] [PubMed] [Google Scholar]
- Liu S, Chang S, Han B, Xu L, Zhang M, Zhao C, Yang W, Wang F, Li J, Delpire E, et al. (2019). Cryo-EM structures of the human cation-chloride cotransporter KCC1. Science 366, 505–508. [DOI] [PubMed] [Google Scholar]
- Mahadevan V, Khademullah CS, Dargaei Z, Chevrier J, Uvarov P, Kwan J, Bagshaw RD, Pawson T, Emili A, De Koninck Y, et al. (2017). Native KCC2 interactome reveals PACSIN1 as a critical regulator of synaptic inhibition. ELife 6, e28270. [DOI] [PMC free article] [PubMed] [Google Scholar]
- McCoy AJ, Grosse-Kunstleve RW, Adams PD, Winn MD, Storoni LC, and Read RJ (2007). Phaser crystallographic software. J. Appl. Crystallogr 40, 658–674. [DOI] [PMC free article] [PubMed] [Google Scholar]
- Monette MY, and Forbush B (2012). Regulatory Activation Is Accompanied by Movement in the C Terminus of the Na-K-Cl Cotransporter (NKCC1). J. Biol. Chem 287, 2210–2220. [DOI] [PMC free article] [PubMed] [Google Scholar]
- Moore YE, Kelley MR, Brandon NJ, Deeb TZ, and Moss SJ (2017). Seizing Control of KCC2: A New Therapeutic Target for Epilepsy. Trends Neurosci. 40, 555–571. [DOI] [PubMed] [Google Scholar]
- Otwinowski Z, and Minor W (1997). Processing of X-ray diffraction data collected in oscillation mode. Methods Enzymol. 276, 307–326. [DOI] [PubMed] [Google Scholar]
- Park JH, and M.H.S. Jr. (1996). Phylogenetic, Structural and Functional Characteristics of the Na-K-Cl Cotransporter Family. J. Membr. Biol 149, 161–168. [DOI] [PubMed] [Google Scholar]
- Puskarjov M, Ahmad F, Kaila K, and Blaesse P (2012). Activity-Dependent Cleavage of the K-Cl Cotransporter KCC2 Mediated by Calcium-Activated Protease Calpain. J. Neurosci 32, 11356–11364. [DOI] [PMC free article] [PubMed] [Google Scholar]
- Rinehart J, Maksimova YD, Tanis JE, Stone KL, Hodson CA, Zhang J, Risinger M, Pan W, Wu D, Colangelo CM, et al. (2009). Sites of Regulated Phosphorylation that Control K-Cl Cotransporter Activity. Cell 138, 525–536. [DOI] [PMC free article] [PubMed] [Google Scholar]
- Rivera C, Voipio J, Payne JA, Ruusuvuori E, Lahtinen H, Lamsa K, Pirvola U, Saarma M, and Kaila K (1999). The K+/Cl- co-transporter KCC2 renders GABA hyperpolarizing during neuronal maturation. Nature 397, 251–255. [DOI] [PubMed] [Google Scholar]
- Robert X, and Gouet P (2014). Deciphering key features in protein structures with the new ENDscript server. Nucleic Acids Res. 42, W320–W324. [DOI] [PMC free article] [PubMed] [Google Scholar]
- Schrödinger, LLC (2015). The PyMOL Molecular Graphics System, Version 1.8.
- Strange K, Singer TD, Morrison R, and Delpire E (2000). Dependence of KCC2 K-Cl cotransporter activity on a conserved carboxy terminus tyrosine residue. Am. J. Physiol.-Cell Physiol 279, C860–C867. [DOI] [PubMed] [Google Scholar]
- Tanis JE, Bellemer A, Moresco JJ, Forbush B, and Koelle MR (2009). The Potassium Chloride Cotransporter KCC-2 Coordinates Development of Inhibitory Neurotransmission and Synapse Structure in Caenorhabditis elegans. J. Neurosci 29, 9943–9954. [DOI] [PMC free article] [PubMed] [Google Scholar]
- Touw WG, Baakman C, Black J, te Beek TAH, Krieger E, Joosten RP, and Vriend G (2015). A series of PDB-related databanks for everyday needs. Nucleic Acids Res. 43, D364–D368. [DOI] [PMC free article] [PubMed] [Google Scholar]
- Trowitzsch S, Bieniossek C, Nie Y, Garzoni F, and Berger I (2010). New baculovirus expression tools for recombinant protein complex production. J. Struct. Biol 172, 45–54. [DOI] [PubMed] [Google Scholar]
- Warmuth S, Zimmermann I, and Dutzler R (2009). X-ray Structure of the C-Terminal Domain of a Prokaryotic Cation-Chloride Cotransporter. Structure 17, 538–546. [DOI] [PubMed] [Google Scholar]
- Winn MD, Ballard CC, Cowtan KD, Dodson EJ, Emsley P, Evans PR, Keegan RM, Krissinel EB, Leslie AGW, McCoy A, et al. (2011). Overview of the CCP 4 suite and current developments. Acta Crystallogr. D Biol. Crystallogr 67, 235–242. [DOI] [PMC free article] [PubMed] [Google Scholar]
- Yoshida A, Nakano S, Suzuki T, Ihara K, Higashiyama T, and Mori I (2016). A glial K + /Cl − cotransporter modifies temperature-evoked dynamics in Caenorhabditis elegans sensory neurons: Regulation of neural activity by a glial KCC. Genes Brain Behav. 15, 429–440. [DOI] [PubMed] [Google Scholar]
- Zhou H-Y, Chen S-R, Byun H-S, Chen H, Li L, Han H-D, Lopez-Berestein G, Sood AK, and Pan H-L (2012). N -Methyl-d-aspartate Receptor- and Calpain-mediated Proteolytic Cleavage of K + -Cl − Cotransporter-2 Impairs Spinal Chloride Homeostasis in Neuropathic Pain. J. Biol. Chem 287, 33853–33864. [DOI] [PMC free article] [PubMed] [Google Scholar]
Associated Data
This section collects any data citations, data availability statements, or supplementary materials included in this article.
Data Availability Statement
The coordinates and structure factors for the CeKCC-1 CTD construct A (proteolyzed protein) and construct B (intact protein) have been deposited in the Protein Data Bank under ID codes 6VW9 and 6VWA, respectively.