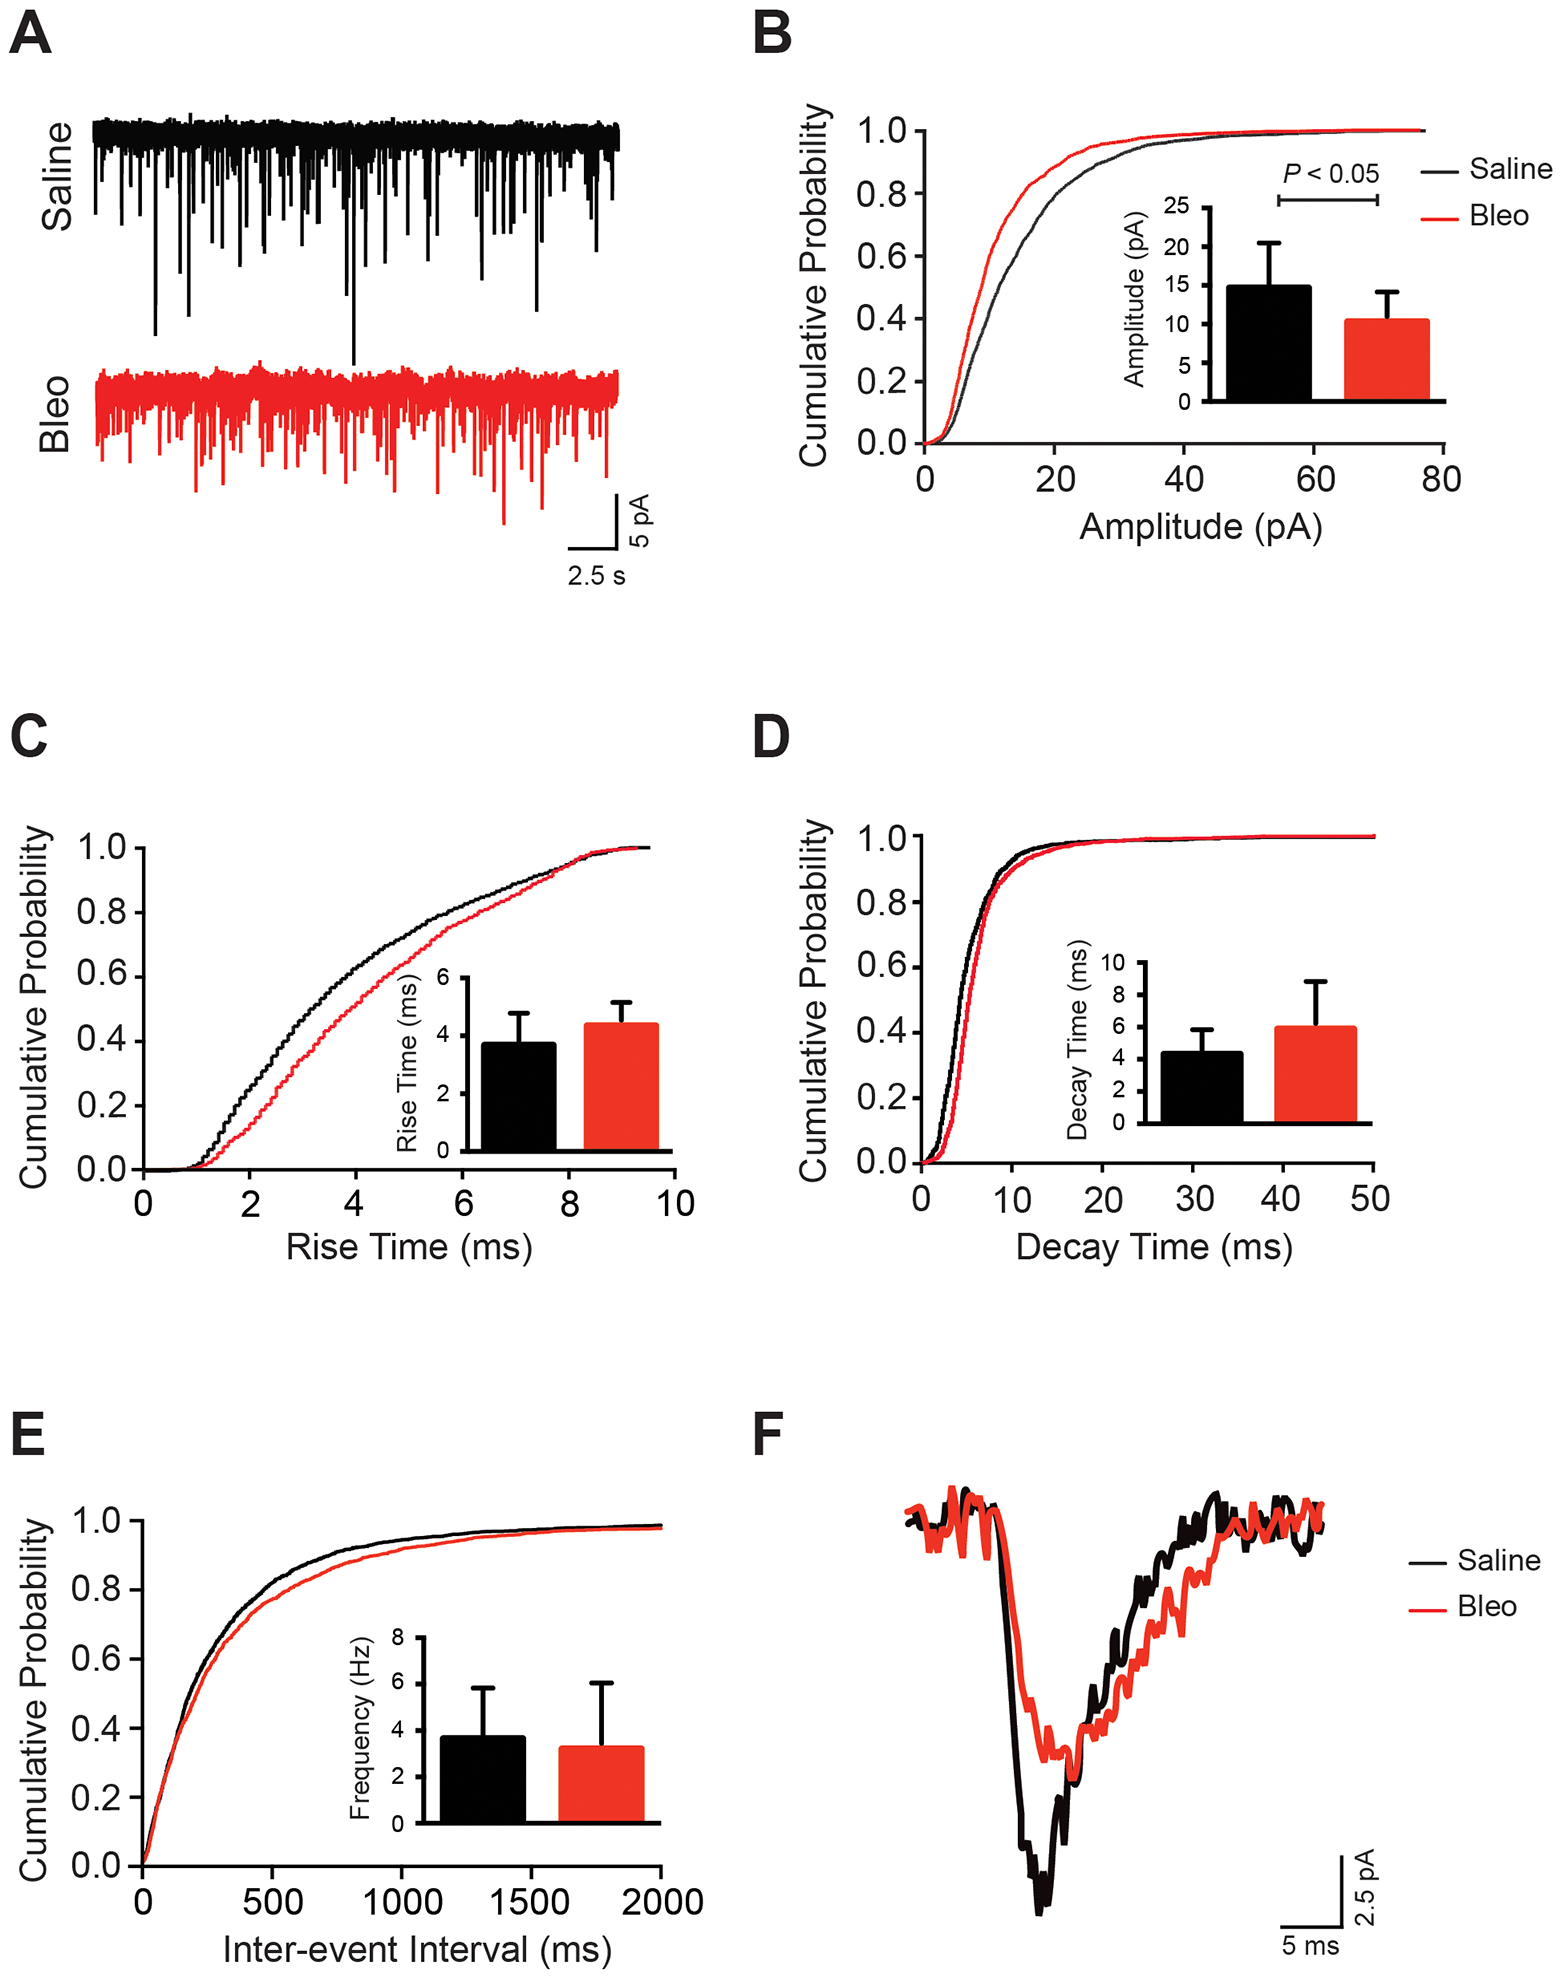
Figure 3. Amplitude is significantly decreased in miniature EPSCs following acute lung injury.

Data presented in this figure was collected from whole cell patched 2nd-order nTS neurons. A. Representative trace from saline and Bleo treated 2nd-order nTS neurons showing mEPSCs over the course of a 30 second epoch. B-E. Cumulative probability plots with inset bar graphs representing mean data ± standard deviation. (B) The amplitude of mEPSCs was significantly decreased (P=0.03) in Bleo compared to saline treated rats (see inset), which was reflected in a leftward shift in the cumulative probability plot. A trend towards slower rise time (P=0.08) (C) and decay time (P=0.09) (D) of mEPSCs in Bleo compared to saline groups, but differences did not reach statistical significance. (E) There was no significant difference in the frequency of mEPSCs between Bleo and saline 2nd-order neurons (P=0.65). Bleo group (n=12 neurons, 12 slices, 12 rats); saline group (n=14 neurons, 14 slices, 14 rats). Cumulative probability plots represent all cells patched from Bleo and saline treated rats. F. Representative trace overlaying a single mEPSC from a saline and Bleo 2nd-order nTS neuron.
