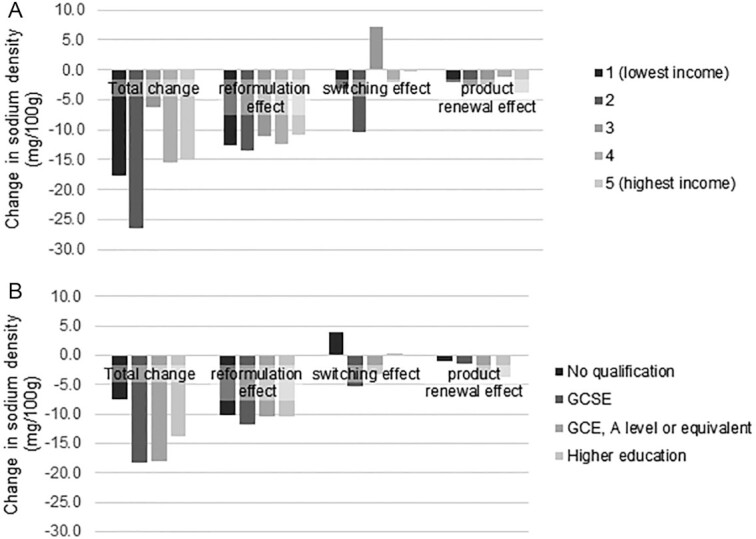
FIGURE 1.

Changes in sodium density of all foods and beverages consumed between Y1 and Y9, by socioeconomic status. (A) The whole population (i.e., 1334 and 995 individuals in Y1 and Y9, respectively) was stratified by income quintile. (B) The adult population (i.e., 639 and 482 individuals in Y1 and Y9, respectively) was stratified by the highest qualification obtained. Abbreviations: GCSE, General Certificate of Secondary Education; GCE, General Certificate of Education; Y, year.
