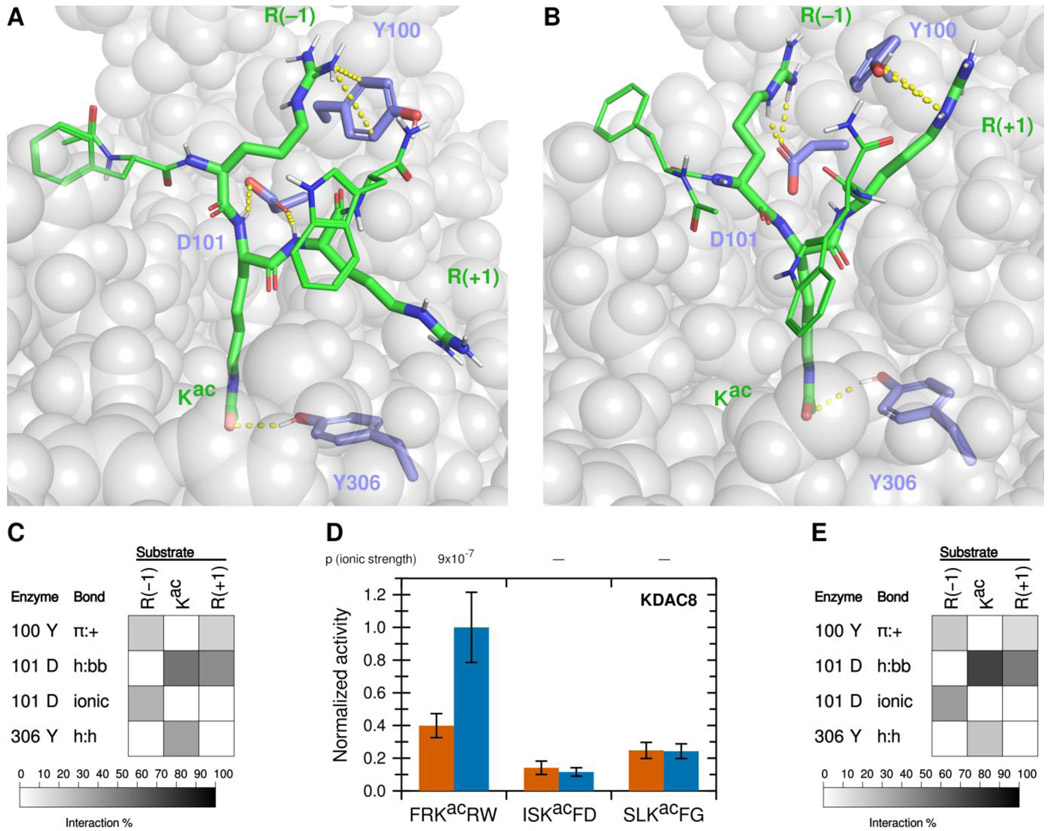
Figure 1. A novel ionic interaction exists between KDAC8 and FRKacRW.
(A) Snapshot of MD simulation between KDAC8 and FRKacRW demonstrating the interactions of Y100-R(−1) π:+, and previously reported interactions D101-Kac h:bb, D101-R(+1) h:bb, and Y306-Kac h:h (dashed yellow lines). KDAC8 (grey spheres) and side chains of important KDAC8 residues for substrate interaction are shown along with the FRKacRW peptide (sticks colored by atom: carbon green [substrate] or periwinkle [enzyme], oxygen red, nitrogen blue, polar hydrogen white). (B) Snapshot of MD simulation between KDAC8 and FRKacRW demonstrating the interactions of D101-R(−1) ionic, Y100-R(+1) π:+, and Y306-Kac h:h (dashed yellow lines). Coloring is the same as panel A. (C) Results of MD analysis identifying interactions between KDAC8 residues and FRKacRW substrate residues in high ionic strength assay buffer. Shading corresponds to the percent of time a particular interaction was observed during MD simulations. (D) Average normalized activity of KDAC8 with previously identified peptide substrates in either high ionic strength (red) or low ionic strength (blue) buffer. All activity was normalized to FRKacRW in low ionic strength buffer. Error bars represent standard deviations (n≥4), and p-values are shown for statistically significant differences for the comparisons between the activity in the two ionic strengths for each substrate. (E) Results of MD analysis identifying interactions between KDAC8 residues and FRKacRW substrate residues in low ionic strength assay buffer. Shading corresponds to the percent of time a particular interaction was observed during MD simulations.

