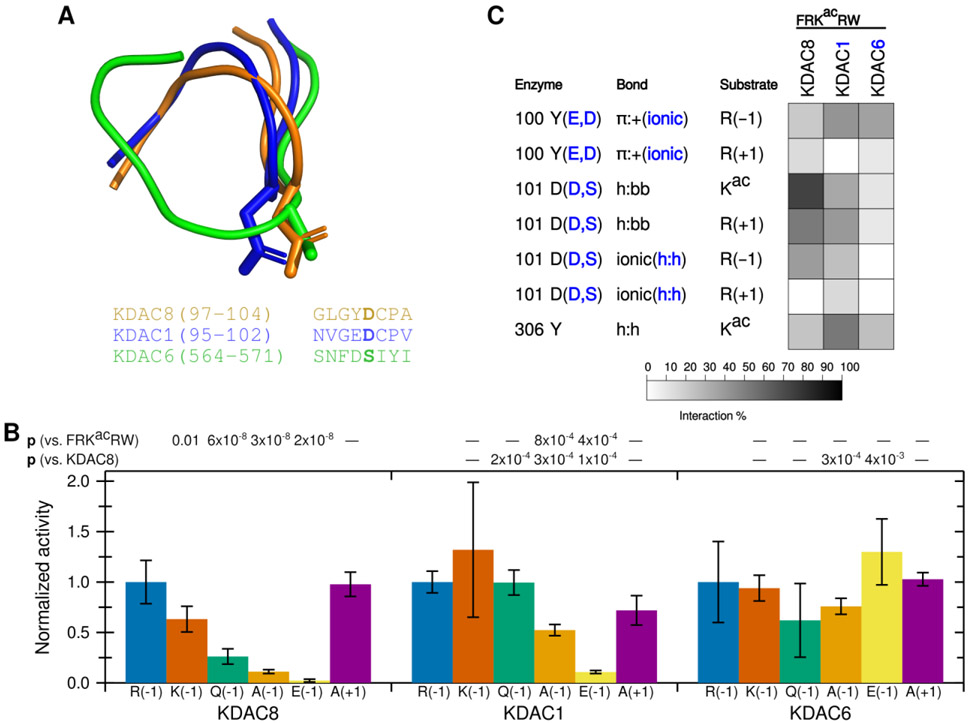
Figure 7. D101 ionic interaction is specific to KDAC8.
(A) Structure (top) and sequence (bottom) alignments of KDAC8 (orange), KDAC1 (blue), and KDAC6 (green) were generated from previously reported crystal structures (PDB: 2v5xA, 4bkxB, and 5eduA).13,27,28 The segment of the structure-guided sequence alignment corresponding to the L2 loop of each KDAC is displayed. The side chain of KDAC8 D101 and the structurally equivalent residues KDAC1 D99 and KDAC6 S568 are shown as stick representations. (B) KDAC8, KDAC1, and KDAC6 were all reacted with FRKacRW (blue), FKKacRW (red), FQKacRW (green), FAKacRW (orange), FEKacRW (yellow), and FRKacAW (purple). Specific activity was normalized so that for each KDAC, activity with FRKacRW was represented as 1. Error bars represent standard deviations (n≥4). p-values are shown for statistically significant differences between activity with FRKacRW and activity with each other substrate within a single enzyme set (top row), and for normalized KDAC8 activity compared to normalized activity of other enzymes for each substrate except FRKacRW (bottom row). KDAC8 data are reproduced from previous figures for comparative purposes. (C) Results of MD analysis comparing interactions between specific residues in the KDACs and the FRKacRW substrate. Shading corresponds to the percent of time a particular interaction was observed during MD simulations.

