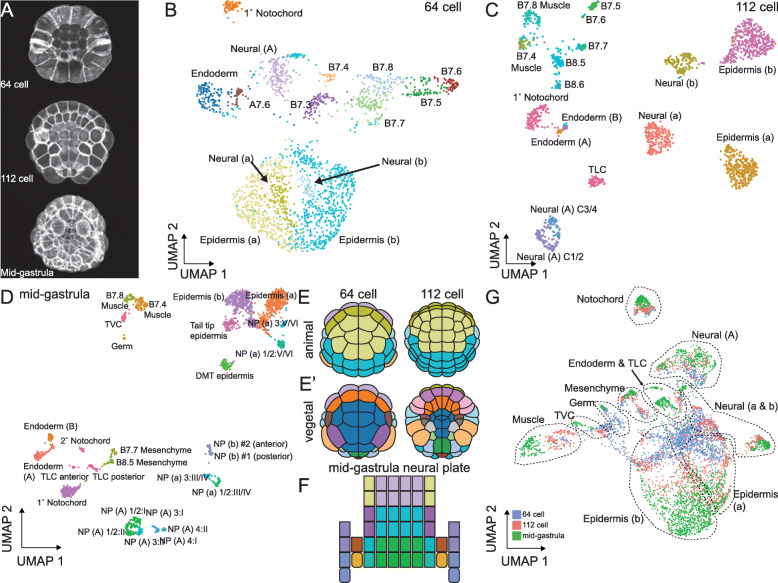
Fig. 1.
Ciona scRNAseq at the 64-cell, 112-cell, and mid-gastrula stages. A Z-projections of confocal images of embryos at each stage analyzed. Anterior is up in all images. B–D UMAP plot of STAMPs in control embryos dissociated at the 64-cell (B), the 112-cell (C), and the mid-gastrula (D) stages. NP—neural plate, NP X:Y represents the cell in row X and column Y of the neural plate. E Cartoon representations of the animal and vegetal views of the embryo at the 64-cell and 112-cell stages. Colors correspond to the stage matched UMAP plot in B and C. F Cartoon depiction of the neural plate at the mid-gastrula stage. Colors in F match the corresponding points in D. G UMAP plot of all control STAMPs collected across all three developmental stages. Dashed lines delineate broad lineages of the embryo

