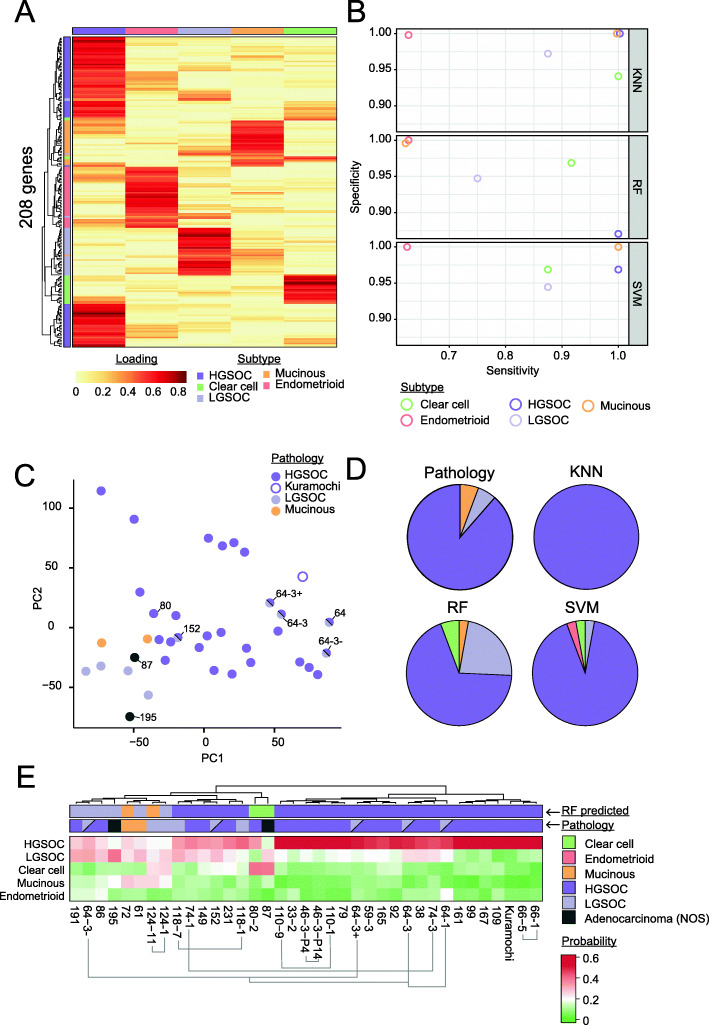
Fig. 4.
Ability of a k-nearest neighbour classifier to predict subtype of ovarian cancer cell lines. A Metagene signatures for which high expression is informative of each cluster were extracted using gene scoring scheme as per Kim and Park [44]. Colours represent the strength of the association between that gene and the cluster, where red indicates the strongest association. The top track indicates cluster number, as per Fig. 2. B Evaluation of three machine learning algorithms for OC cell line subtype classification: k-nearest neighbour (KNN), random forest (RF) and support vector machine (SVM). Cell lines were designated the subtype indicated by NMF clustering and partitioned into 4 subsets. Three subsets were used to train each of the machine learning algorithms, with the fourth set held out as a test set. The four subsets were rotated such that each sample had the opportunity to be trained and tested upon. The average per-class sensitivity and specificity score across the four tested sets are shown. Balanced accuracy scores for HGSOC were 1 (KNN), 0.935275 (RF) and 0.984375 (SVM), and the overall kappa values for each model are 0.918 (KNN), 0.78905 (RF) and 0.878 (SVM). C Principal component analysis of patient-derived OCMs. Colours indicate the subtype determined by a pathologist. D Comparison of the identified subtype based upon pathology, and the k-nearest neighbour (KNN), random forest (RF) and support vector machine models trained in B deployed on the OCMs. E Closer inspection of the performance of the RF model. Pathology and RF-predicted subtype are indicated above the heatmap. HGSOC cell line Kuramochi is included in parts C–D as a positive control. The models are referred to using the OCM prefix followed by the patient number and, if one of a series, the biopsy number. + EpCAM positive; − EpCAM negative; P4 and P14 indicate passage number of this OCM; NOS, not otherwise specified

