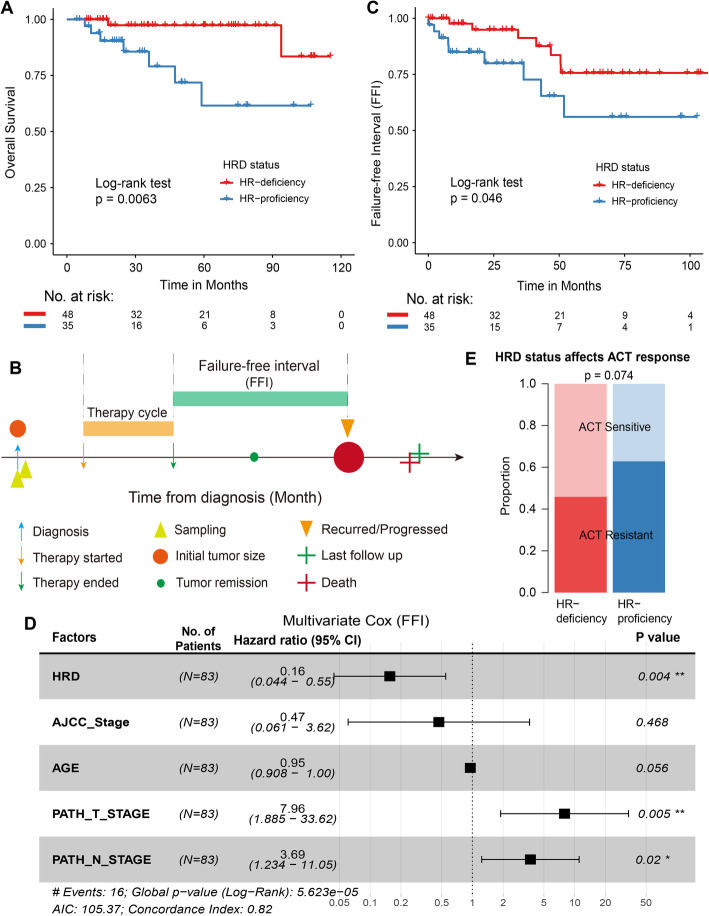
Fig. 3.
Homologous recombination repair deficiency correlates with ACT chemotherapy benefits. A, C Kaplan-Meier graphs of HRD status on OS (A) and FFI (C). Statistical significance was calculated using the log-rank test. B Conceptual depiction of the TNBC patients undergoing ACT chemotherapy. D Forest plot illustrating the HR (95% CI) for FFI calculated using the multivariate Cox proportional hazard models. HR, hazard ratios; CI, confidence interval. E Distribution of ACT sensitive (light colour) or resistant (dark colour) in patients with HR deficiency (red) and HR proficiency (blue)

