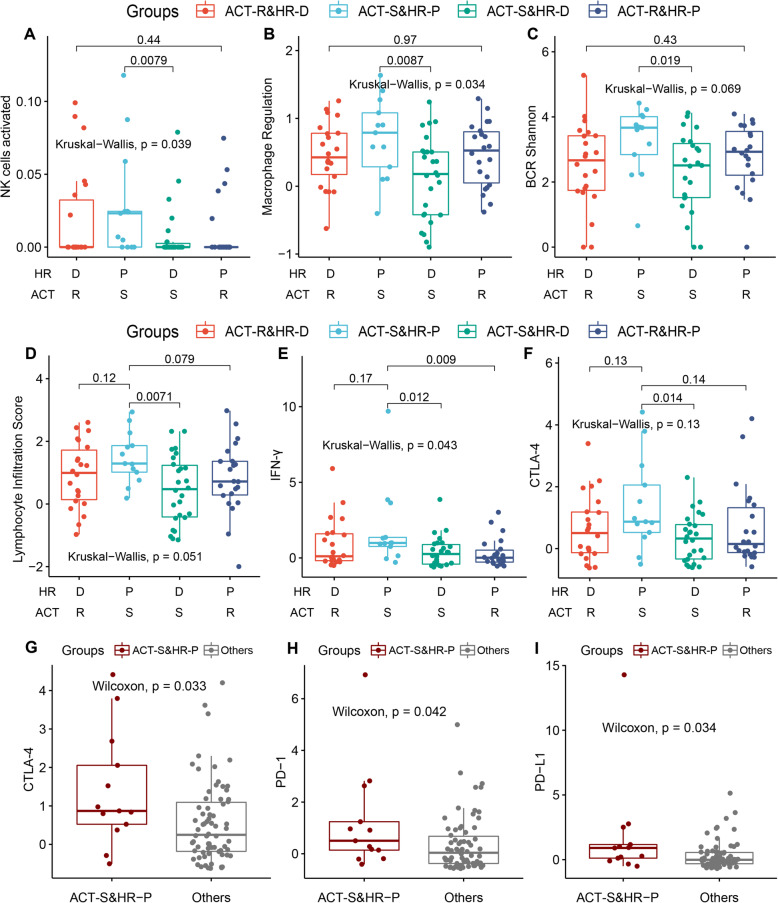
Fig. 4.
Analysis of the immune microenvironment mechanism in TNBC patients. A–D The box diagram showing the distribution of activated NK cells (A) and the immune molecular and cellular characteristics, including regulatory macrophages (Mregs, B), BCR repertoire diversity (C) and tumour-infiltrating lymphocytes score (D). E, F Under different HRD status and distinct ACT responses, the patients with IFN-γ activity (E) and the expression of CTLA-4 (F) were diverse. P-value between the two (among multiple) groups was calculated by the Wilcoxon rank-sum (Kruskal-Wallis) test, the same below. ACT-S&HR-D: sensitive to ACT and HR deficiency (26 cases); ACT-S&HR-P: sensitive to ACT and HR proficiency (13 cases); ACT-R&HR-D: resistant to ACT and HR deficiency (22 cases); and ACT-R&HR-P: resistant to ACT and HR proficiency (22 cases). G–I The elevated expression of known cancer immunotherapy biomarkers, including CTLA-4 (G), PD-1 (H) and PD-L1 (I), were correlated with ACT-sensitive and HR proficiency (ACT-S&HR-P). The others mean all samples except ACT-S&HR-P

