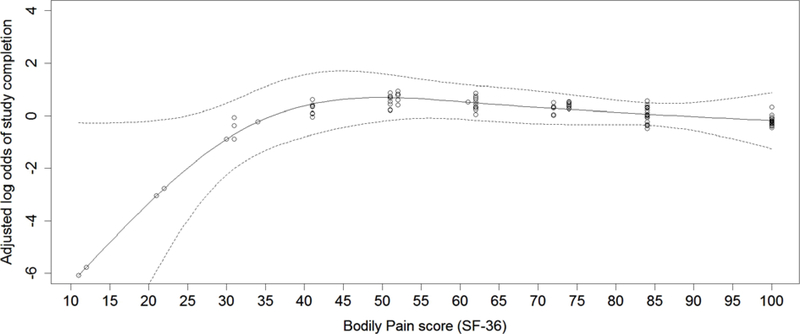
Figure 2.
Association between bodily pain (SF-36) and study completion.
Note 1: Circles in the plots represents predicted values based on the observed data. Multiple individuals had same subscale score: individuals with the same subscale score have the same predicted values on the estimated smoothed function. To visualize the number of observations across the subscale score range and to prevent overlapping values due to same subscale score, values were jittered by adding random noise.
Note 2: Solid line represents the estimated function from GAM, when adjusted for covariates of race (dichotomized as non-Hispanic whites vs. other) and disease stage (dichotomized as disease stage I vs. higher).
Note 3: The dotted lines represent 95% confidence bands.

