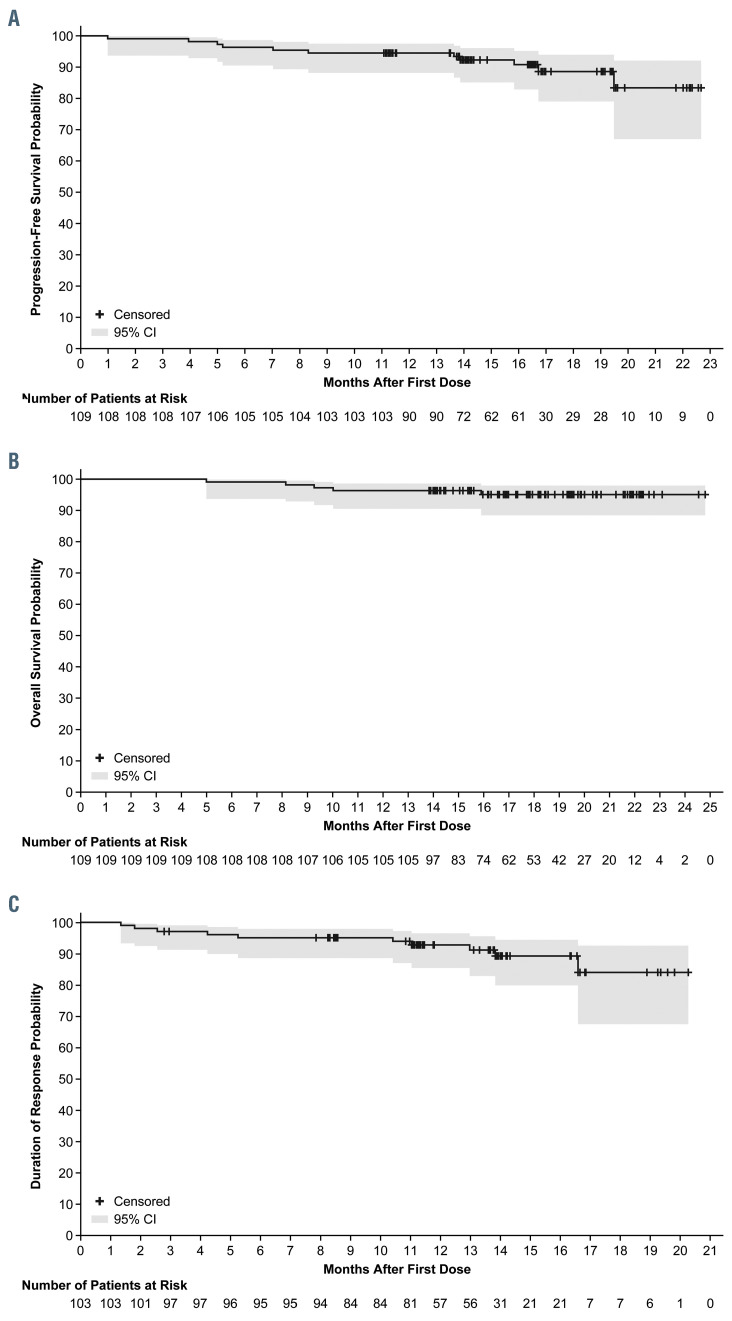
Figure 1.
Survival and response analyses using the Kaplan-Meier method. (A) Progression-free survival as determined by investigator assessment. Shaded area indicates 95% Confidence Interval (CI). (B) Overall survival. Shaded area indicates 95% CI. (C) Duration of response as determined by investigator assessment. Shaded area indicates 95% CI.

