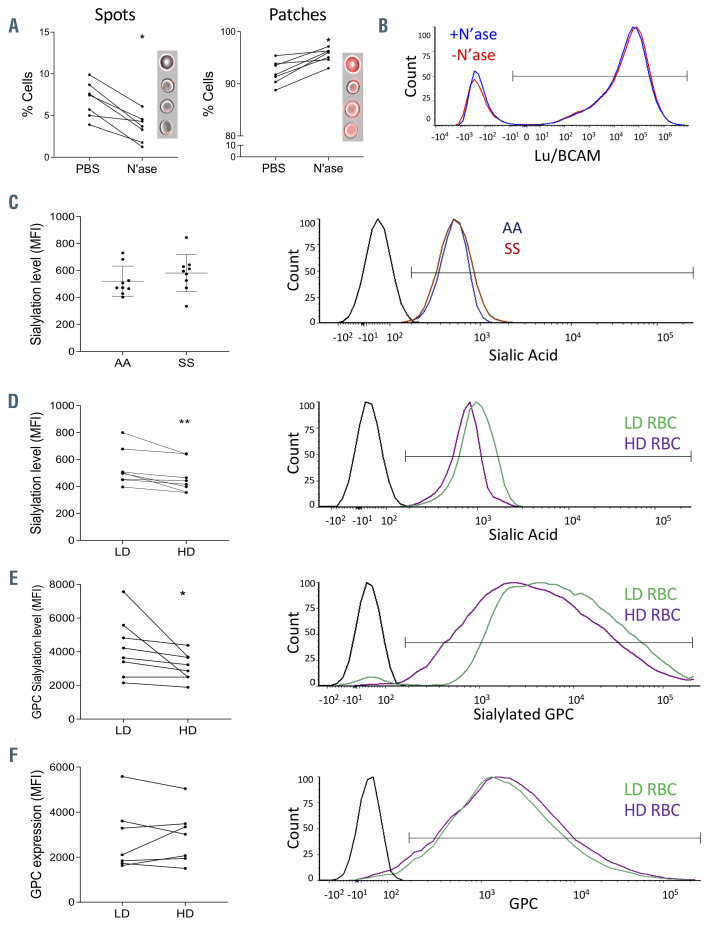
Figure 5.
Sialic acid levels, glycophorin C sialylation and Lu/BCAM distribution in AA and SS red blood cells. (A) Impact of neuraminidase (N’ase) treatment on Lu/BCAM Spots and Patches patterns on AA red blood cells (RBC). Wilcoxon test, *P<0.05. (B) Representative flow cytometry plots of Lu/BCAM expression in RBC treated or not with neuraminidase. (C) Left panel: sialic acid levels expressed as mean fluorescence intensity (MFI) on the RBC surface of 11 SS and nine AA samples. No significant difference was found between both groups. Mann-Whitney test, P=0.224. Right panel: representative flow cytometry plots of sialic acid distribution on one AA and one SS RBC samples. (D) Left panel: sialic acid levels expressed as MFI on the RBC surface of eight low-density (LD) and high-density (HD) samples. Wilcoxon test, **P<0.01. Right panel: representative flow cytometry plots of sialic acid distribution on LD and HD RBC from the same SS blood sample. (E) Left panel: glycophorin C (GPC) sialylation levels expressed as mean fluorescence intensity (MFI) on the RBC surface of eight LD and HD samples. Wilcoxon test, *P<0.05. Right panel: representative flow cytometry plots of silalylated GPC on LD and HD RBC from the same SS blood sample. (F) Left panel: GPC expression represented as MFI on the RBC surface of eight LD and HD samples. No significant differences were observed. Wilcoxon test, P=0.64. Right panel: representative flow cytometry plots of GPC expression on LD and HD RBC from the same SS blood sample.

