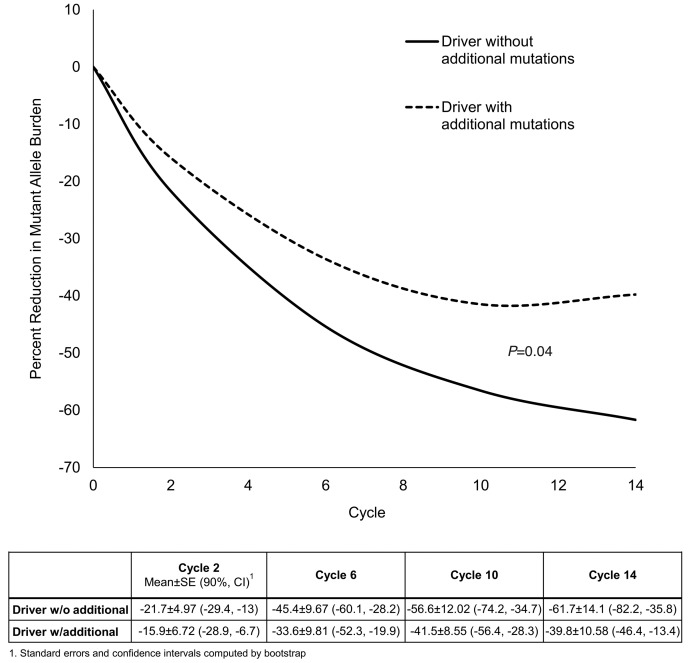
Figure 3.
Mean phenotypic driver mutant allele burden over time. The solid line represents the driver mutant allele burden in patients without additional mutations (n=8). The dashed line represents the driver mutant allele burden in patients with additional mutations. Patients without additional mutations reached significantly lower mutant allele burdens (P=0.04).

