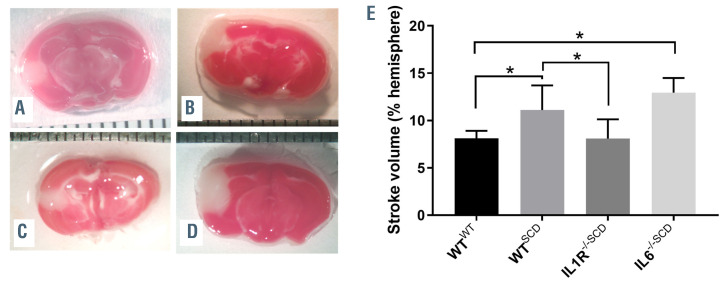
Figure 2.
Stroke area following middle cerebral artery occlusion. Representative brain sections stained with 4% 2,3,5-triphenyltetrazolium chloride (TTC) to assess stroke size (in white) of (A) Wt,WTbmt, (B) Wt,SCDbmt, (C) IL1R-/-,SCDbmt mice, and (D) IL6-/-,SCDbmt mice. (E) Quantification of stroke volume (mean ± standard deviation). The brain sections were imaged with a Nikon SMZ-2T microscope and Spot Idea camera model 29.2-13MP using at Nikon 0.45x TV lens and Spot 5.1 software. *P<0.05 as determined by ANOVA.

