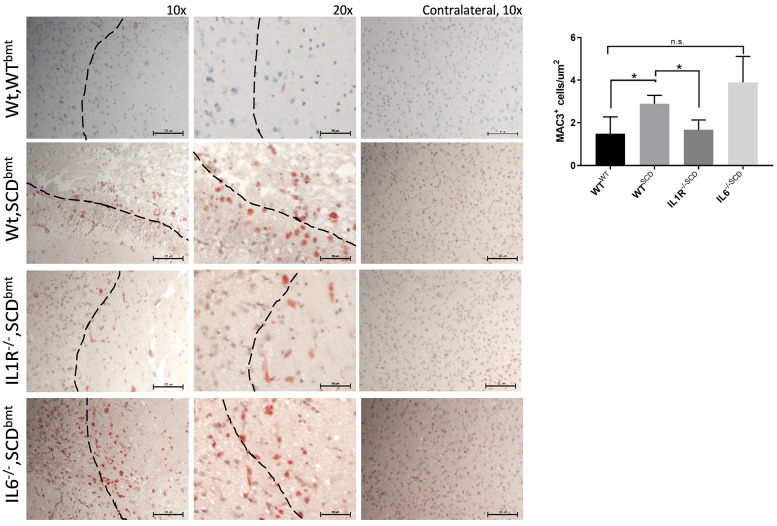
Figure 3.
Post-stroke macrophage infiltration. Representative images of MAC3-positive cells in the peri-infact area of Wt,WTbmt, Wt,SCDbmt, IL1R-/-,SCDbmt and IL6-/-,SCDbmt mouse brains, and quantification (mean ± standard deviation). A Nikon SE upright microscope and a Nikon DS-Fi3 camera was used to capture 10x and 20x images of ipsilateral brain and 10x images of contralateral brain. Dotted line denotes transition between infarcted area and heathy tissue. *P<0.05 as determined by ANOVA.

