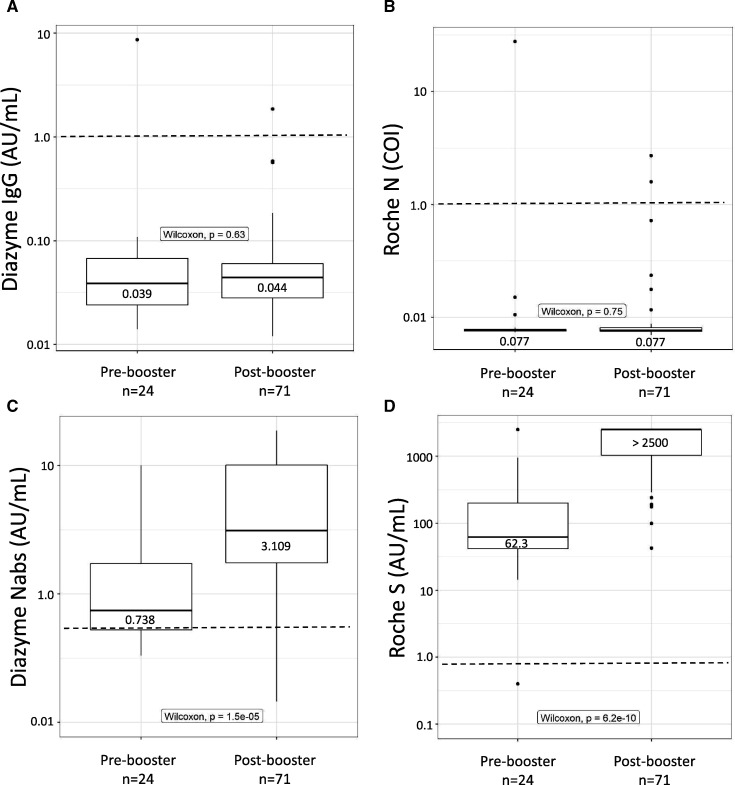
Fig. 1.
Commercialized platforms detect vaccinated individuals. (A–D), Box plots illustrating the distribution of values observed on the Diazyme IgG, Roche N-antibody, Diazyme NAbs, and Roche S-antibody assays. Vaccinated individuals are stratified based on whether or not they had received a booster shot (pre- vs post-booster). Observed values are plotted on the y axis on a log10 scale. The dashed line indicates the cutoff for each platform with values above representing positive results and values below indicating negative results. Median values and interquartile ranges are indicated for each box-plot. Whiskers are up to 1.5 times the interquartile range.

