
Figure 4. Temporal Characterization of Phenotypic Profiles and CP POD.
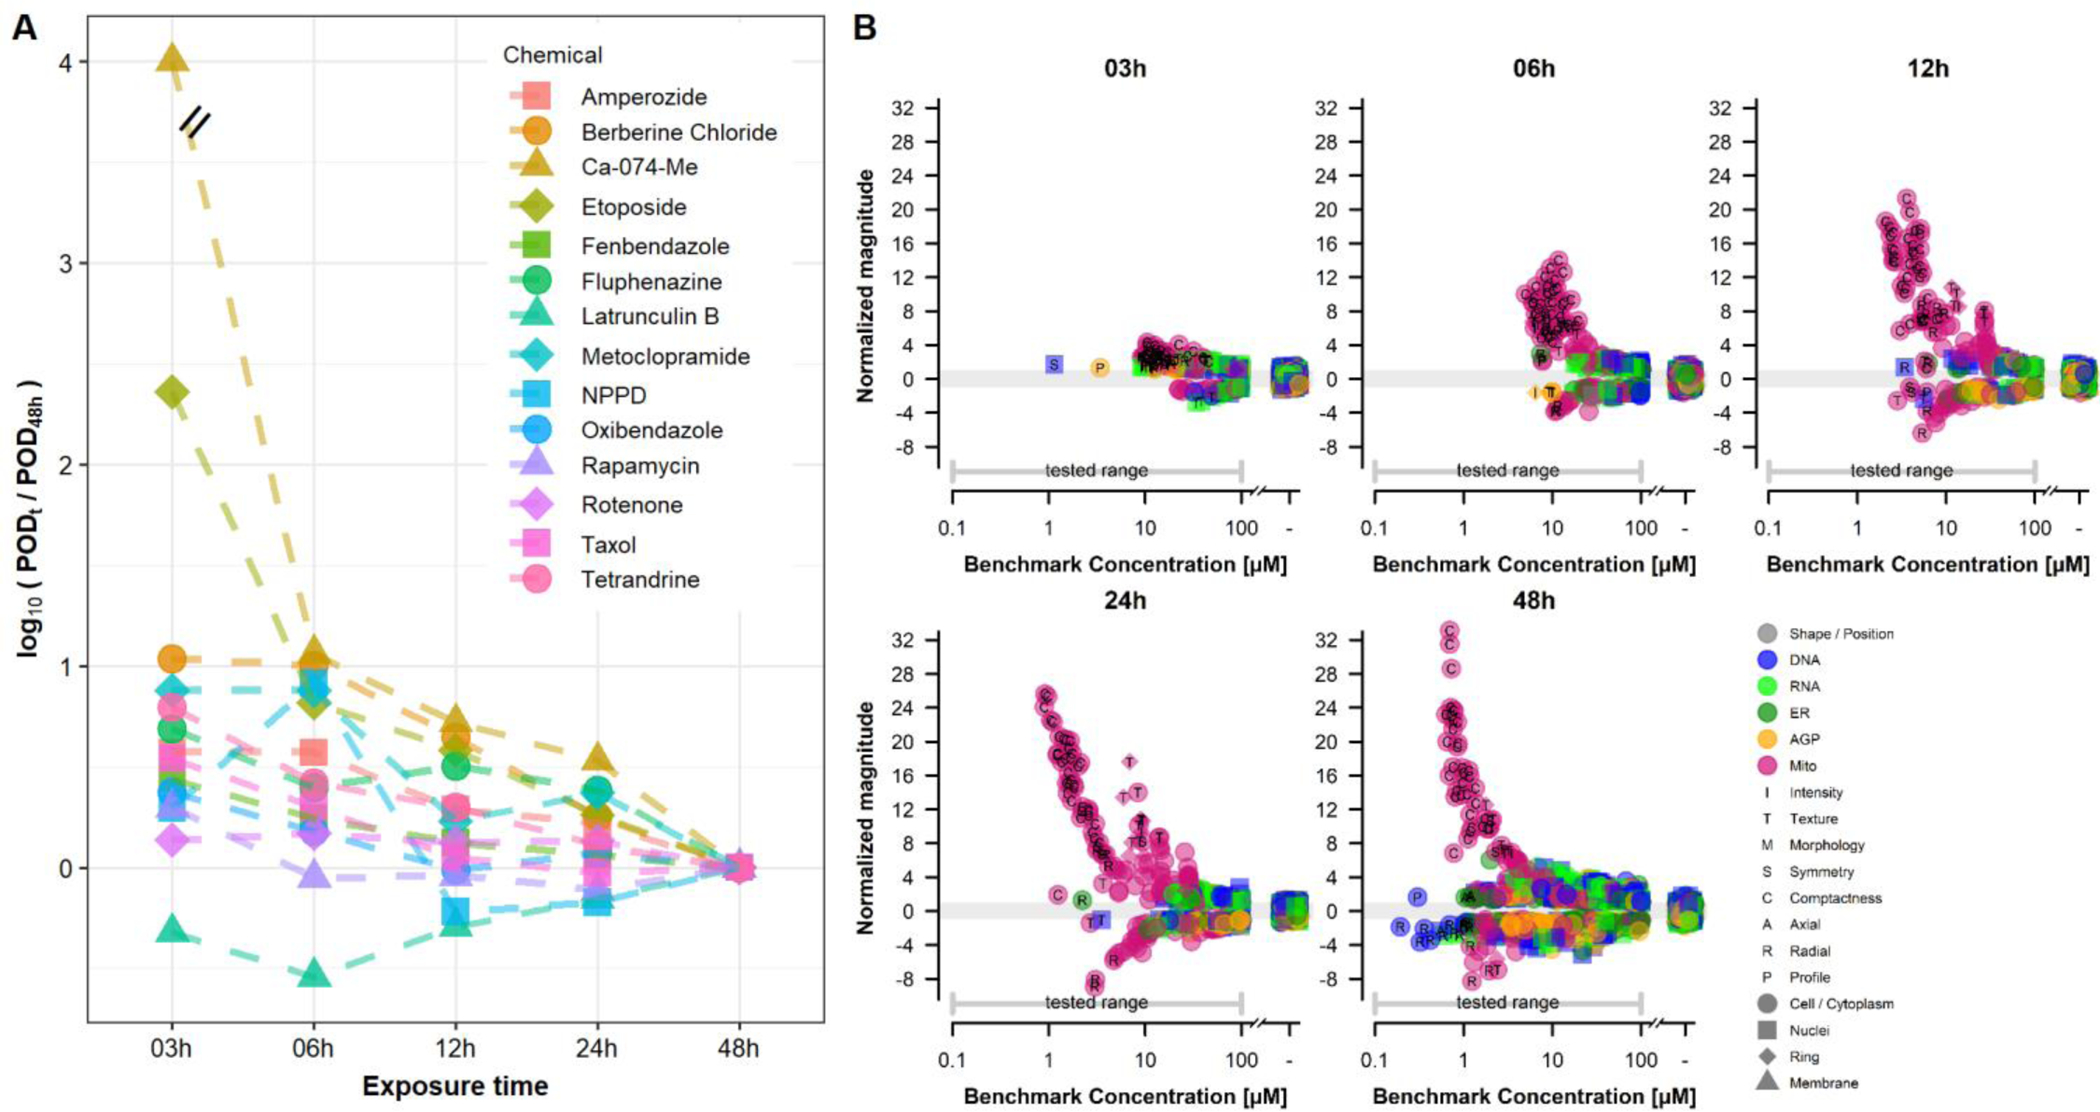
U-2 OS cells were treated with chemicals in the Reference Set for 3, 6, 12, 24 or 48 h prior to sampling and imaging. (A) CP PODs were calculated for each of 14 phenotypic reference chemicals for each exposure duration as described in the Methods. The ratio of the CP POD at 48 hours versus the CP POD at shorter exposure durations was calculated. For four chemical x exposure time combinations, there was no CP POD at the maximal tested concentration. The maximal tested concentration + ½ log10 was used as a surrogate. For most chemicals, the CP POD was stable (i.e. did not vary more than one order of magnitude) between 12 and 48 h exposure durations. (B) Potency-magnitude plots for an exemplary reference chemical, berberine chloride, at different exposure durations. Concentration-response modeling of feature data was performed, and feature-level BMCs calculated as described in Methods. The normalized magnitude (y-axis) was defined as the largest effect size observed at a non-cytotoxic concentration (see Fig. S9B for details). Points on each plot represent the BMC and normalized magnitude for a feature, coded by channel (color), compartment (shape) and feature type (letter). The gray shaded area is at −1 < magnitude < 1 and represents the threshold for a marked response from control for scaled feature data. Note that the magnitude of effects on mitochondrial morphology increases with longer exposure durations. Data was derived from ~300 cells/well across 3 technical replicate wells and 3 biological replicates (n = 9 wells total).