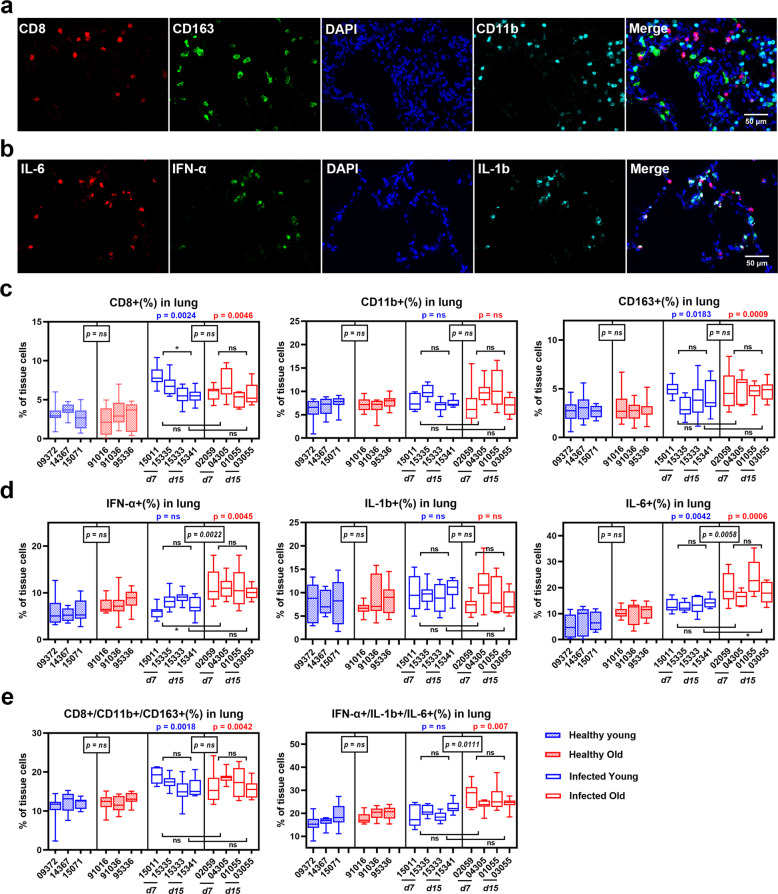
Fig. 3.
SARS-CoV-2-induced inflammatory cell infiltration in lung tissue of old RMs. a, b mIF images showing the co-staining results of inflammatory cells (a) and inflammatory factors (b) in lung tissue sections. Red, green, and cyan indicate staining of protein markers, and blue DAPI staining indicates nucleus. c–e Box plots showing the staining results according to a and b in healthy young, healthy old, infected young, and infected old groups. Data calculated using 10 microscopy images of lung tissue sections from each animal are shown as median with min to max. P value marked in blue indicates the comparison between infected and healthy young groups, and red indicates the comparison between infected and healthy old groups. Boxed p value represents a comparison between young and old RMs in healthy (left) or infected (right) conditions. Square brackets in the figure show a comparison between infected young and old RMs at different time points (7 and 15 DPI). *p ≤ 0.05; ns, p > 0.05

