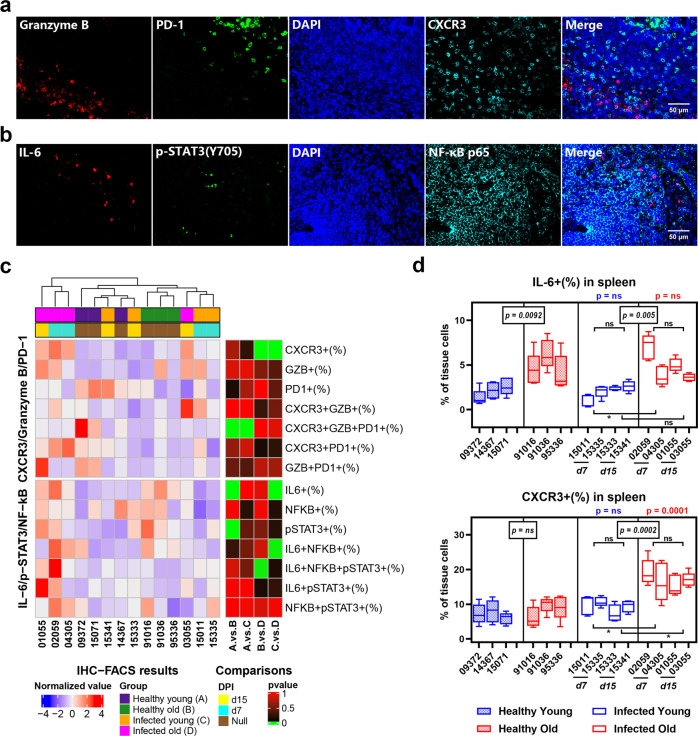
Fig. 5.
Accumulation of CXCR3+ cells in spleen tissues of old RMs infected with SARS-CoV-2. a, b mIF images showing the co-staining results of immune markers in spleen tissue sections. Red, green, and cyan indicate staining of protein markers, and blue DAPI staining indicates nucleus. c Staining results according to a and b of each animal are displayed in a heat map. Annotation bar indicates group and DPI of each sample; heat map on left represents the normalized average frequency of each cell subsets by R’s scale method, mapped by red-white-blue gradient squares; heat map on right represents p values for comparisons between each group, and square with grass green was considered to be a statistically significant difference (p ≤ 0.05). d Box plots showing the frequency of IL-6+ and CXCR3+ cells in spleen tissues in healthy young, healthy old, infected young, and infected old groups. Data calculated using five microscopy images of the spleen tissue section from each animal are shown as median with min to max. P value marked in blue indicates the comparison between infected and healthy young groups, and red indicates the comparison between infected and healthy old groups. Boxed p value represents a comparison between young and old RMs in healthy (left) or infected (right) conditions. Square brackets in the figure show a comparison between infected young and old RMs at different time points (7 and 15 DPI). *p ≤ 0.05; ns, p > 0.05

