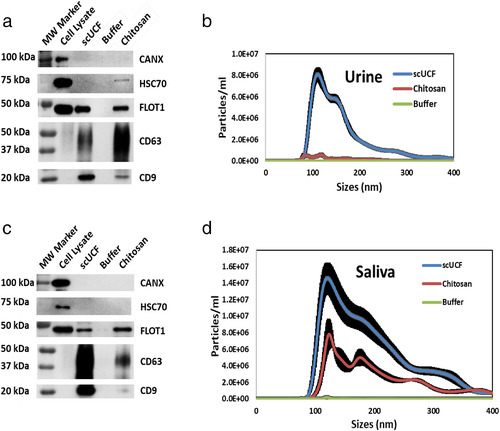
FIGURE 5.

Chitosan‐mediated sEV isolation from human urine and saliva. sEVs were isolated from (a) 1 ml of urine or (c) 1 ml of saliva by scUCF, the addition of the acidic formulation of chitosan (60‐120 kDa) to a final concentration of 50 μg/ml, or buffer followed by Western blot analyses of canonical EV markers CD63, CD9, HSC70, and FLOT1. Blots were also probed for CANX, a non‐sEV marker; total cell lysate from MCF‐10A cells was used as a positive control for CANX. NTA analysis of sEVs isolated from (b) urine or (d) saliva by scUCF, a final concentration of 50 μg/ml of the acidic formulation of chitosan, or buffer. Particle concentration (particles/ml) is plotted against size (nm) of particles. Mean plus the standard error of the mean (n = 3) is shown
