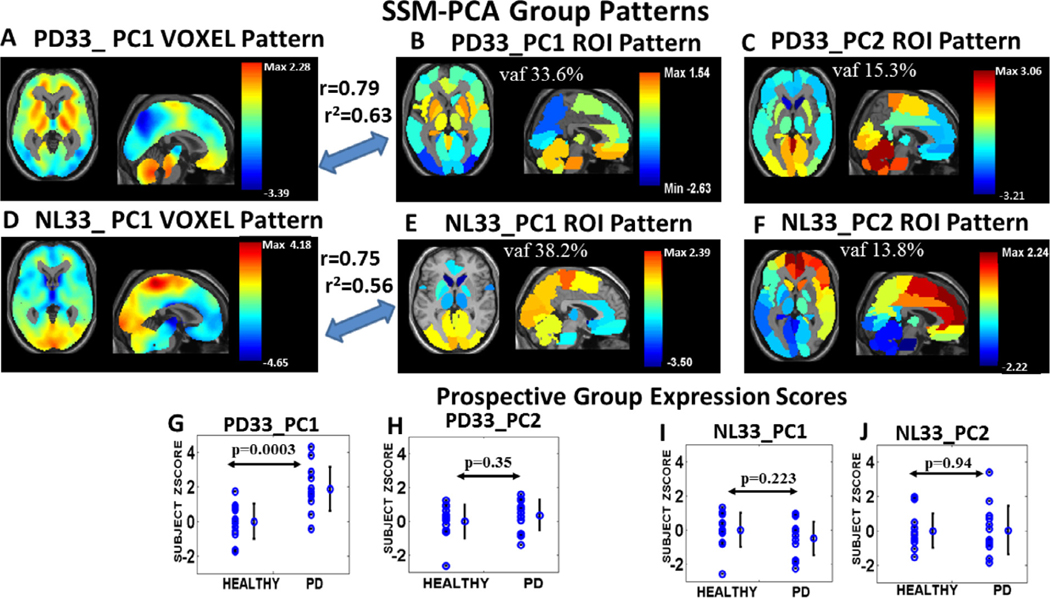
Fig. 1. SSM-PCA derivation group PC pattern maps and prospective group scores.
Axial and sagittal orthogonal tomographic views of SSM-PCA PC1 and PC2 overlapping patterns derived from the PD33 group data (top) and from the NL33 healthy data (middle) are shown in the top two rows overlaid on an anatomical MRI background. Voxel data-based patterns (left A, D) are shown here for PC1 and mean regional data PC vector maps are shown for PC1(center) and PC2 (right). The correlation between the voxel derived patterns and the corresponding regional pattern maps is shown for PC1 (r = 0.79, p < 0.001, for PD33_PC1 and r = 0.75, p < 0.001, for NL33_PC1). The color maps indicate relatively higher metabolic weight in warm color areas and lower weight in cool color areas within the corresponding PC partition layer of the data. Bottom row: Prospective subject scores for each of the regional patterns indicating high discrimination for PD33_PC1 (G, p < 0.0003) between early PD patient (PD13 group) and healthy subjects (NL13 group).

