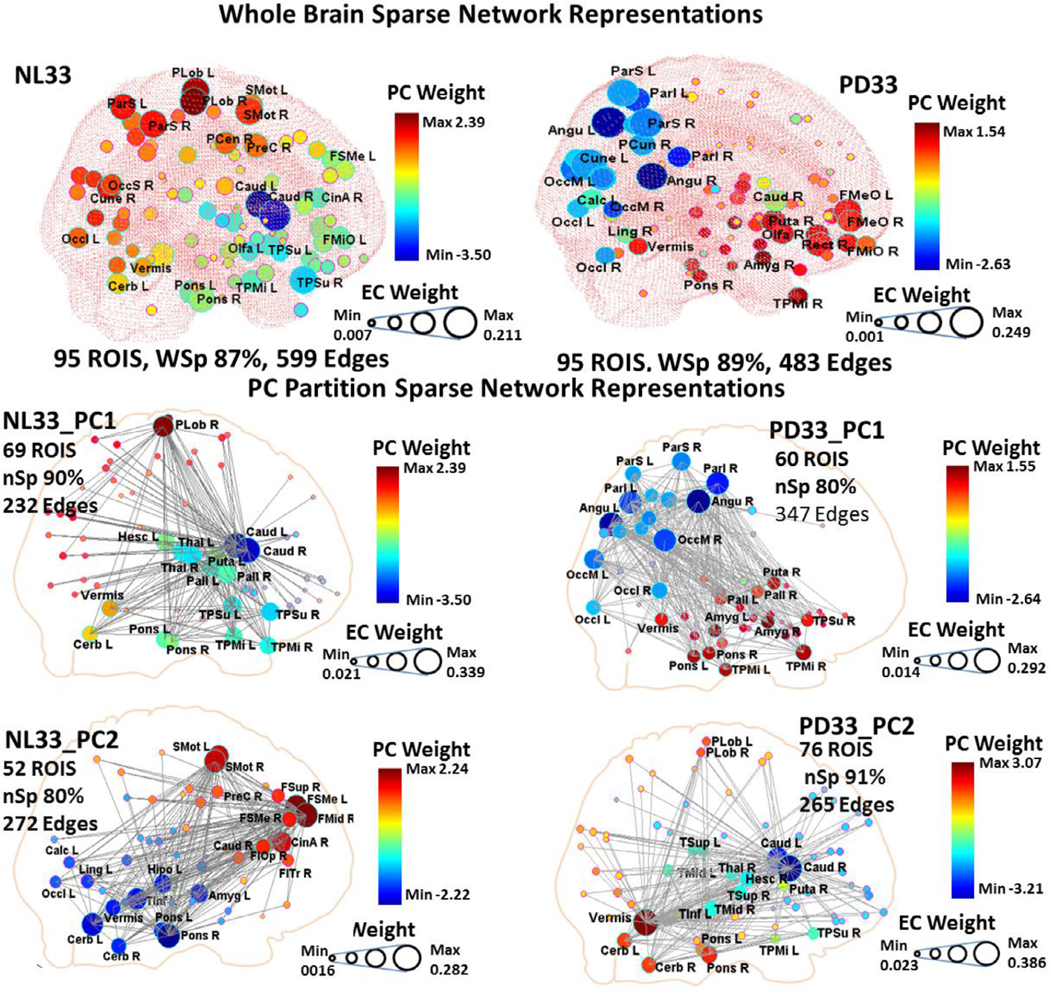
Fig. 2. Sparse network three dimensional representations of original sample data.

Top: Whole brain GLASSO derived nodal configurations for fully connected networks at maximum sparsity are displayed within the three dimensional space of a see-through brain for the NL33 healthy group (left) and the PD33 disease group (right) original data set. Connection edges are only shown within corresponding supplementary circular displays (Fig. S4, left). The diameters of the nodes reflect the EC weights of the corresponding adjacency matrix while the colors correspond to the regional weights of the PC that exhibits the highest absolute value correlation to EC vector weights. Bottom: Sparse network configurations are depicted for the partition layers of the first two PCs for the NL33 group (left) and PD33 (right) derived at specific values of the GLASSO penalty parameter and in circular displays (Fig. S4, right). Each of these PC networks exhibited distinct neuronal pathways with central hub nodes strongly linked to a subset of the whole brain regions.
