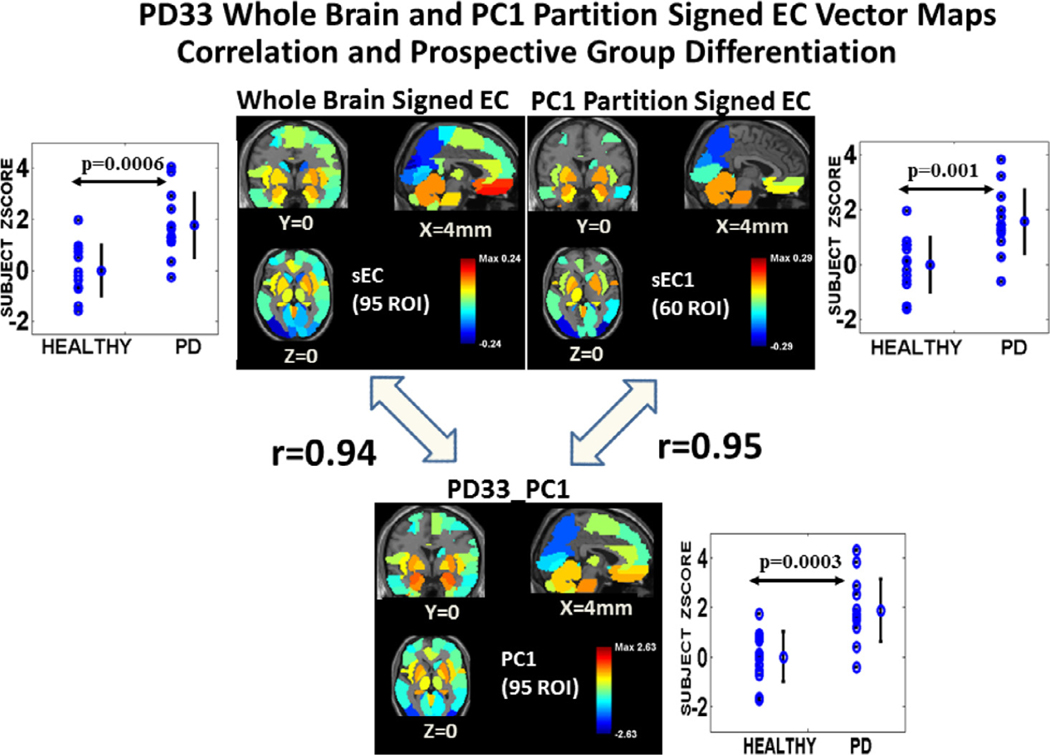
Fig. 3. PD33 whole brain and PC1 partition signed EC vector maps of original sample: Correlation to PD33_PC1 and prospective group differentiation.
Top: The center left image represents the signed EC vector nodal weights of the 95 ROI PD33 whole brain adjacency matrix of the original sample mapped to corresponding voxel space regional areas. Scores for this vector pattern (top left) significantly discriminated the prospective NL13, PD13 group (p = 0.0006). The center right image is the vector map of the signed EC vector weights of the PD33_PC1 partition space for 60 ROIs. Prospective discrimination for this vector pattern (top right) was lower (p = 0.001) but significant. Bottom: The lower image is a vector map of the PD33_PC1 region weights. Correlation of the whole brain signed EC vector (top left) with the PD33_PC1 vector was high (r = 0.94, p < 0.001; Pearson’s correlation), whereas it was low for the secondary component, PD33_PC2 (r < 0.2, p > 0.2; see text). Right: Correlation of the PD33_PC1 vector with the signed EC vector (top right) derived in the PD33_PC1 60 ROI partition space (r = 0.95, p < 0.001) was slightly higher than for the EC of the whole data signal (top left).

