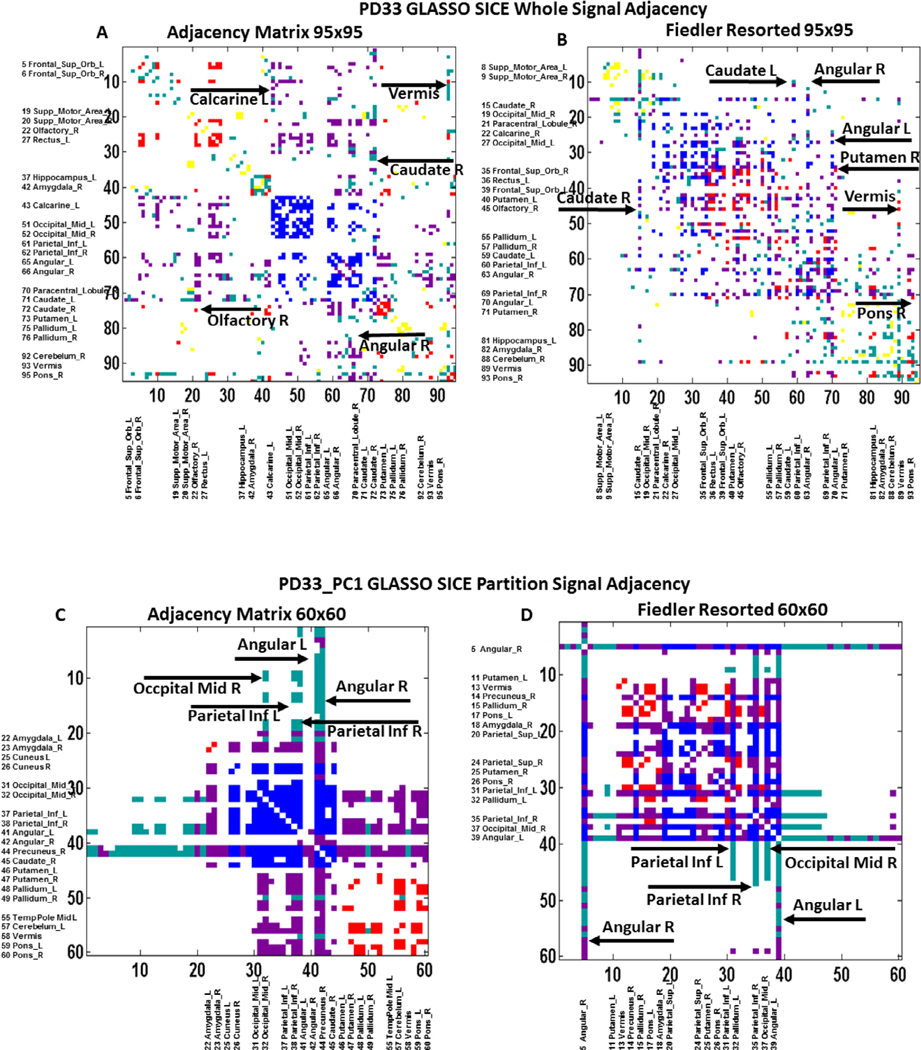
Fig. 4. PD33 whole brain and PD33_PC1 partition unsorted and Fiedler resorted adjacency matrices.
Top : PD33 whole brain adjacency matrix at maximum sparsity for full connectivity for axes ordered in line with the MNI atlas nodal index (left) and resorted in accordance with the magnitude of the Fiedler vector nodal weights (right). Bottom: PD33_PC1 partition data adjacency matrix (left: atlas index ordered) and (right: Fiedler index resorted). The point elements of these matrices (edges) are colored based on whether they connect high EC (EC ≥ 1) nodes and whether the polarity of the two nodes within the group-related most correlated PC vector was positive or negative. Thus, connections linking high EC positive nodes are shown as red, those between high EC negative nodes are shown in blue; connections linking positive to negative high EC nodes are shown in magenta. Connections linking positive or negative high EC to low EC nodes are depicted in cyan. Connections between low EC nodes are depicted in yellow (none). Vertical and horizontal lines of points indicate the edges of single prominent nodes that act as local or global hubs connecting multiple other nodes.

