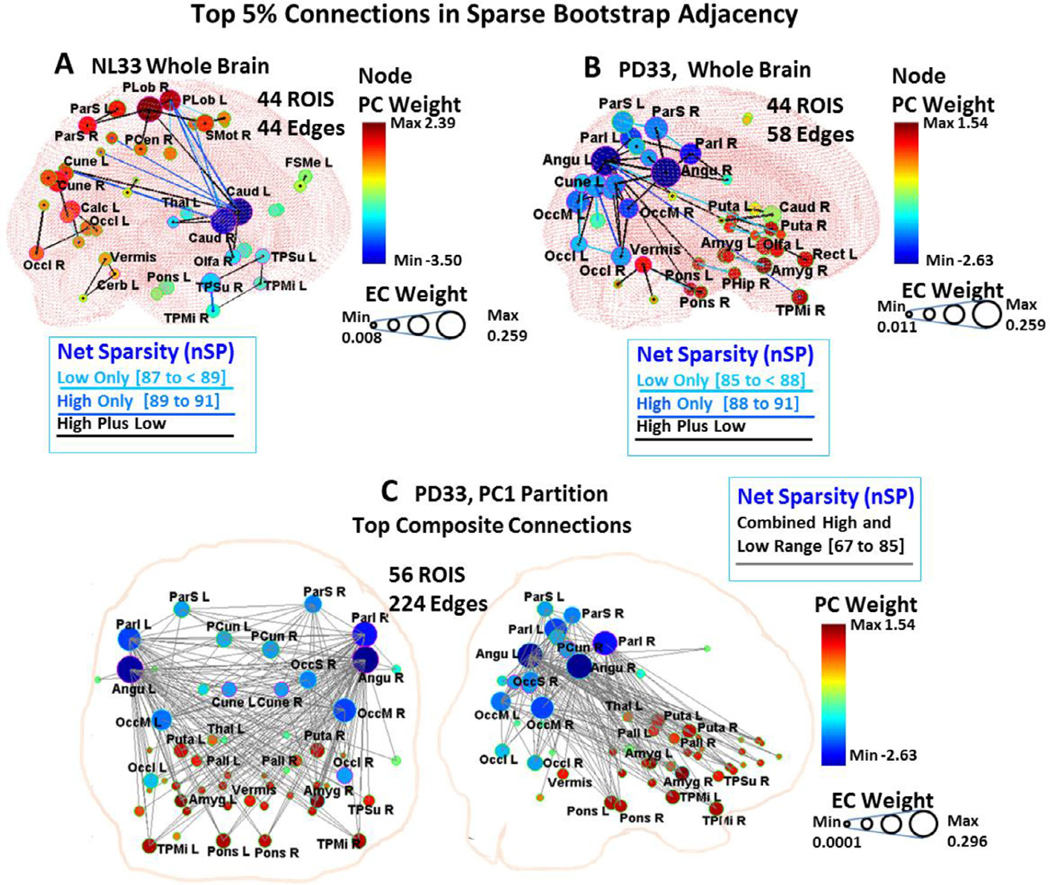
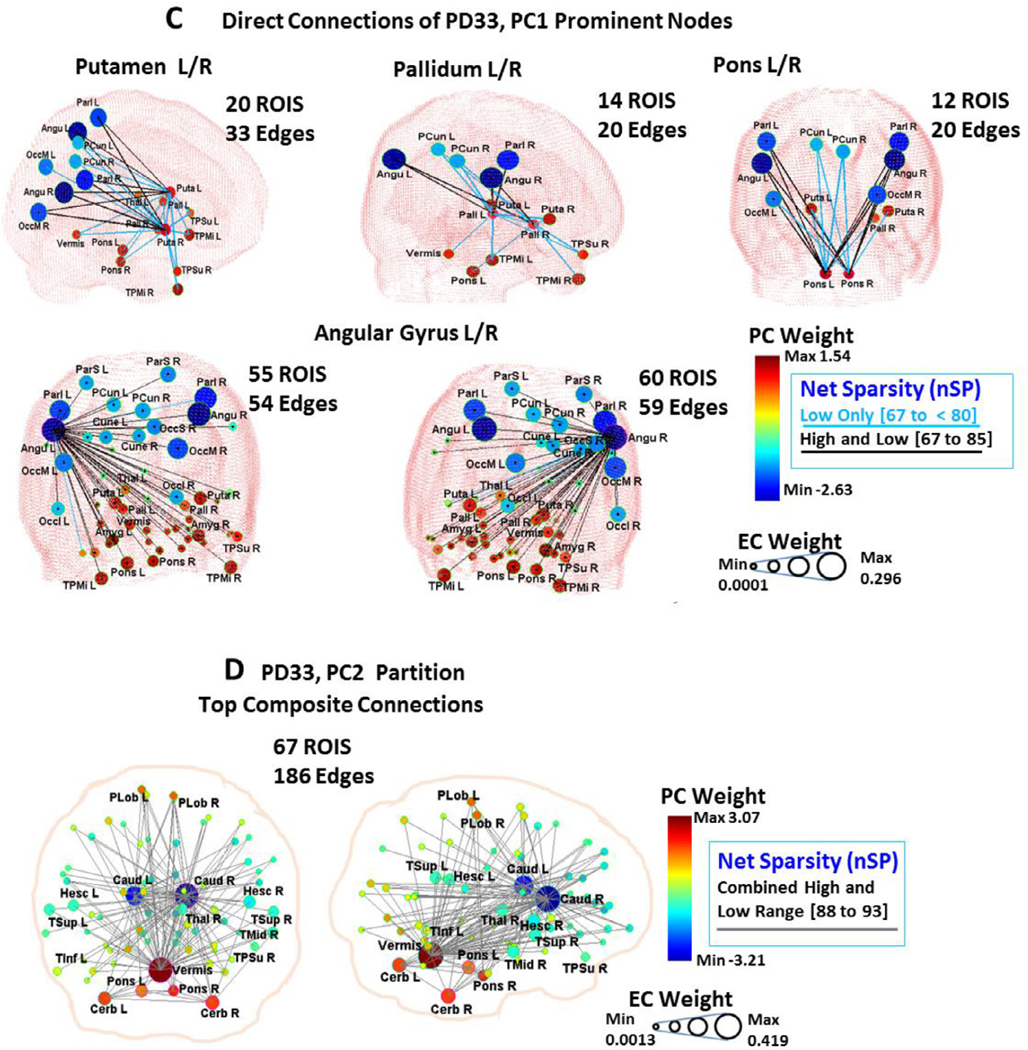
Fig. 6. Top connections of composite bootstrap adjacency matrices.


3D displays (A to D) are depicted for composite bootstrap connections of whole brain healthy NL33 (A) and PD33 (B) data and for PD33 partitions PC1(C) and PC2 (D) for 95 ROIs. Corresponding circular displays are shown in Fig. S6. A dual sparsity range of the adjacency matrices was used to depict the top 5% of connections (95% of bootstrap cases) at lower sparsity and those that are also maintained at high sparsity ranges in each group. Note, however, that the high sparsity connections (dark blue and black or gray) were also present in the top 5% of the lower sparsity range cases (light blue and black) for the partition data and for most of the whole brain data. Connections that are evident only at lower sparsity (light blue lines) are depicted in supplemental circular displays and in the 3D displays of the whole brain data, and for connections of selected nodes in the PD33_PC1 partition (C, bottom 2 rows: left and right angular gyrus, putamen, pallidum and pons). The diameter of the nodes reflects mean EC weight of the component adjacency matrices; the color of the nodes corresponds to the signed weight of the partition PC of that correlated best with the EC vectors for whole brain data:
A: NL33 Whole Signal 200 samples, Total 1730 cases, 44 edges, node color: NL33_PC1;
Lower range wSP: 87% to < 95%, nSP: 87% to < 89%, 618 cases, Top 5%: (37 edges, light blue and black for 29 edges also included in the higher sparsity range); High range wSP: 89% to 95%, nSP: 89% to 91%, 838 cases, Top 5%: (36 edges, blue and black for 29 edges also included in the lower sparsity range).
B: PD33, Whole Signal 200 samples, Total 2319 cases, 58 edges, node color: PD33_PC1;
Lower range wSP: 85% to 95%, nSP: 85% to < 88%, 723 cases, Top 5%: (56 edges, light blue and black for 38 edges also included in the higher sparsity range); High range wSP: 88% to 95%, nSP: 88% to 91%, 1396 cases, Top 5%: (40 edges, dark blue and black for edges also included in the lower sparsity range).
C: PD33_PC1 Partition, 500 samples, Total 2015 cases, node color: PD33_PC1;
Composite 3D display:
Combined range wSP: 85% to 95%, nSp 67% to 85% 1493 cases, Top 5% (224 edges, gray); Circular display (Fig. S6 C):
Lower range wSP: 85% to < 92%, nSP: 67% to < 80%, 535 cases, Top 5% (312 edges, light blue and black for 224 edges also included in the higher sparsity range); High range wSP: 92% to 95%, nSP: 80% to 85%, 958 cases, Top 5%: (224 edges, black, shown gray in composite display).
D: PD33_PC2 Partition, 400 samples, 1932 cases, node color: PD33_PC2; Composite 3D display:
Combined range wSP: 90% to 96%, nSp 88% to 93% 478 cases, Top 5% (186 edges, gray);
Circular display (Fig. S6 D):
Lower range wSP: 90% to < 94%, nSP: 88% to 90%, 788 cases, Top 5% (275 edges, light blue and black for edges also included in the higher sparsity range); High range wSP: 94% to 96%, nSP: 90% to 93%, 203 cases, Top 5% (186 edges, black; shown gray in composite display).
